XRP, Dogecoin, Cardano Price Analysis: 18 May

XRP approached a key resistance mark of $1.55-$1.58 and a breakout could see a 28% price hike towards $1.96. Dogecoin held on to a buy zone at $0.523-0.373 despite bearish broader market cues. Finally, Cardano presented some defensive areas at $1.58 and $1.31, but a bounce back was also possible at $1.96
XRP
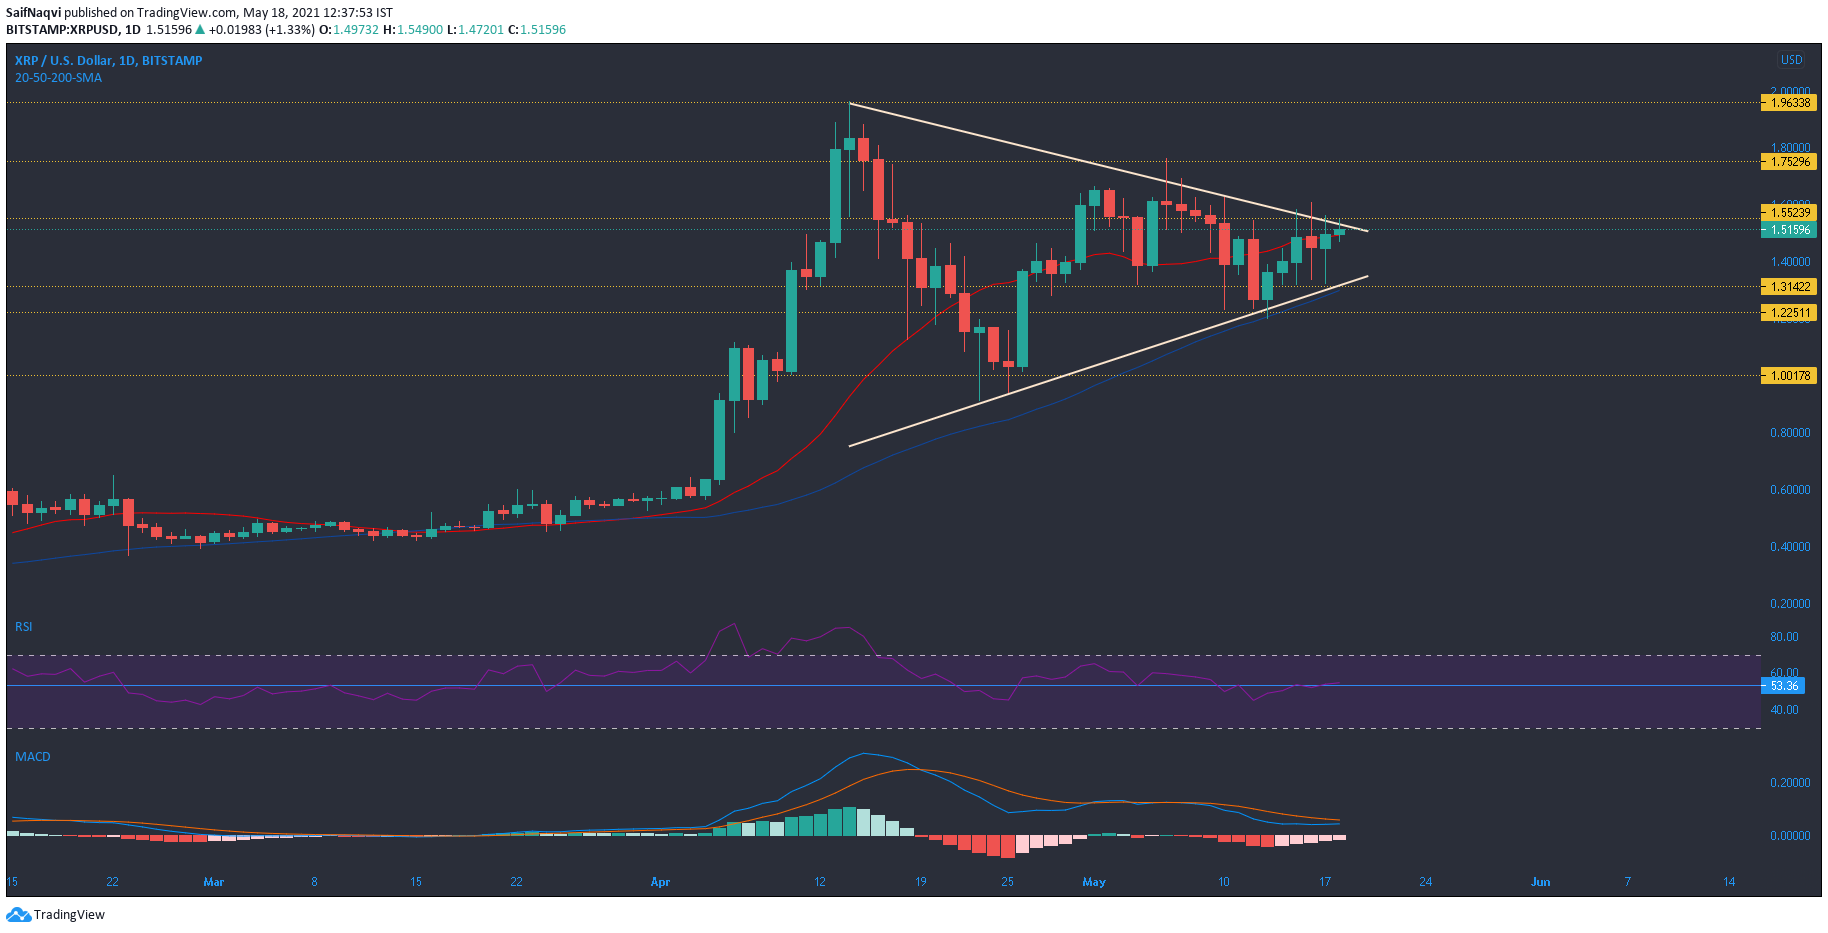
XRP traded within the confines of a symmetrical triangle and its price approached a crucial juncture at $1.55-1.58-resistance. A northbound move above this barrier would also see a symmetrical triangle breakout that could push XRP towards the $3-mark. To invalidate the pattern bears needed to target a fall below $1.31 support – a region that coincided with the 50-SMA (blue).
XRP’s technicals suggested that the market was gradually tilting to a bullish outcome. MACD line caught up with the Signal line and its histogram noted weakening bearish momentum. RSI moved above a resistance line of 50, indicating the asset was in bullish territory.
Dogecoin [DOGE]

While Dogecoin may not have seen astronomical weekly gains that it witnessed during early May, it maintained a key support level between $0.523-0.373. Interestingly, this region also coincided with 20-SMA (blue) on the daily chart. Another defensive line resided at $0.299 and the 50-SMA.
Holding on to these levels was crucial for another DOGE rally. Despite some sideways movement, OBV avoided a decline as buying pressure equaled selling pressure. Squeeze Momentum Indicator noted bearish momentum, but the ‘black dots’ highlighted a market squeeze and decreasing volatility. A breakout above $0.569 on strong volumes would result in another bull run.
Cardano [ADA]
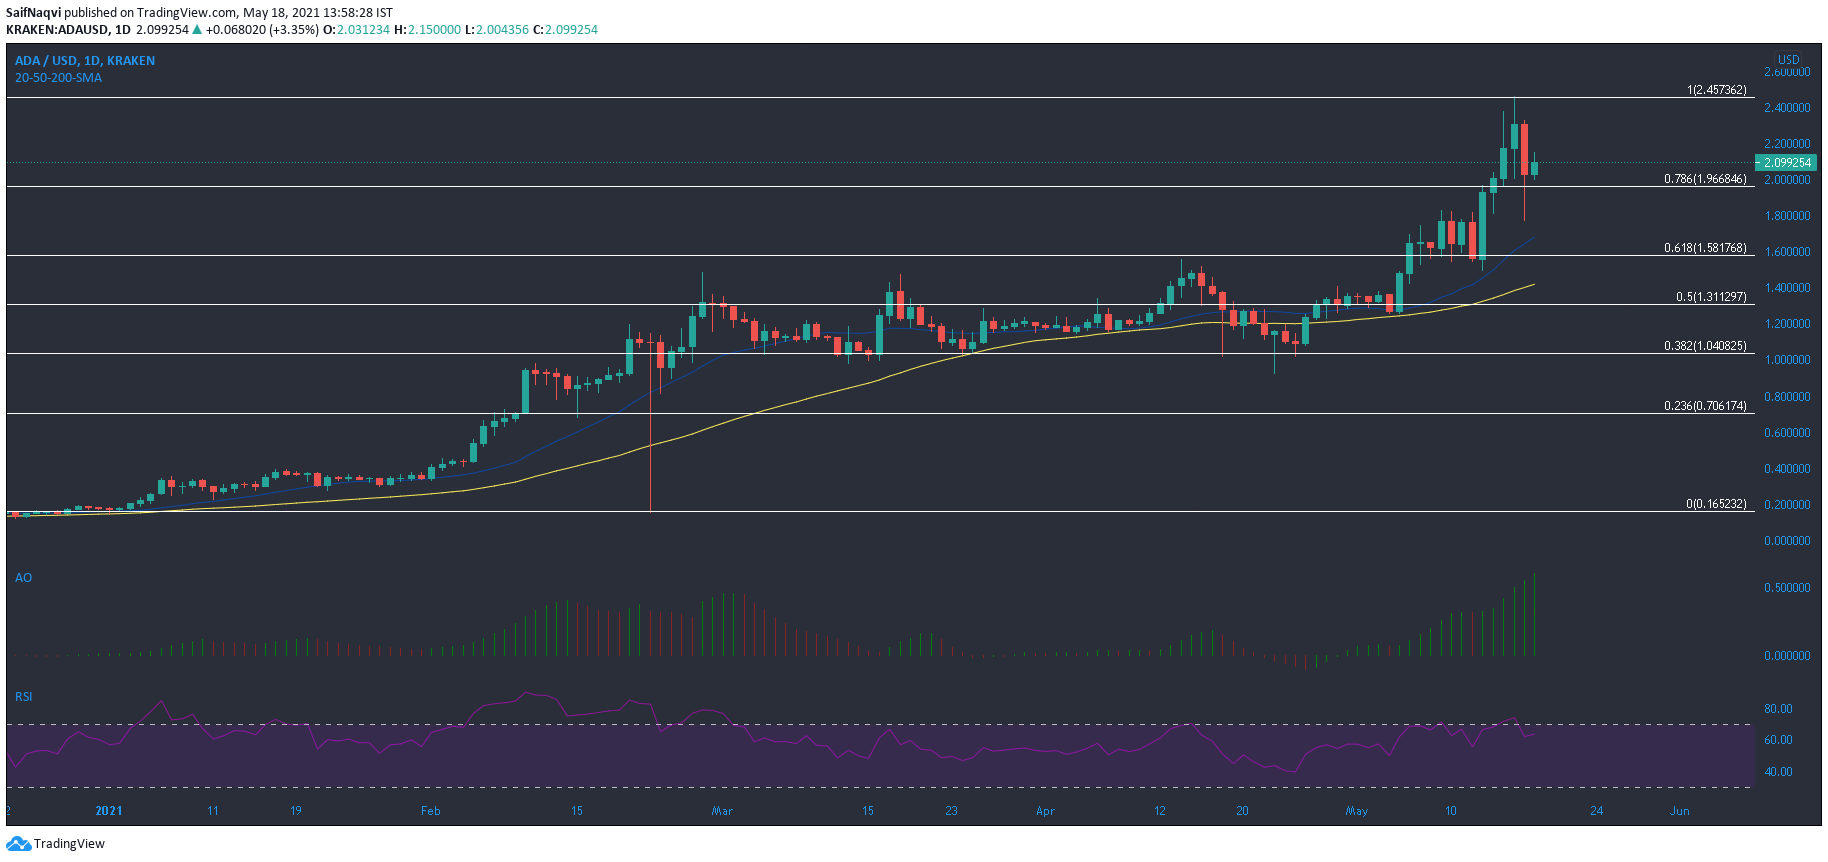
The Fibonacci tool highlighted some support levels for Cardano as the market entered a correctional phase. A strong buy zone lay at the 61.8% Fibonacci level at $1.58. Moreover, this region was backed by the 20-SMA. Even the 50% level at $1.31 (50-SMA) could alleviate some short-term losses. Although unlikely, a fall below both short-term moving averages could see a shift of dynamics over to the bearish side.
According to Awesome Oscillator, buying pressure was still a prevalent force in the market. RSI stabilized below the overbought zone. A swift bullish response around the 78.6% ($1.96) Fibonacci level could fuel another price hike over the coming days.