XRP, Dogecoin, Polkadot Price Analysis: 23 June
The last 24 hours brought some smiles to many as the market recovered somewhat after a 48-hour bear attack. In fact, the total market capitalization was up by 10.19 and rising further, at press time.
XRP, for example, engaged in bullish momentum and rose by 13.01% while keeping within its previous resistance level. Further, Dogecoin finally recovered to its pre-June 19 NASCAR crash levels and Polkadot added to the rising market with a 10% hike in its price.
XRP
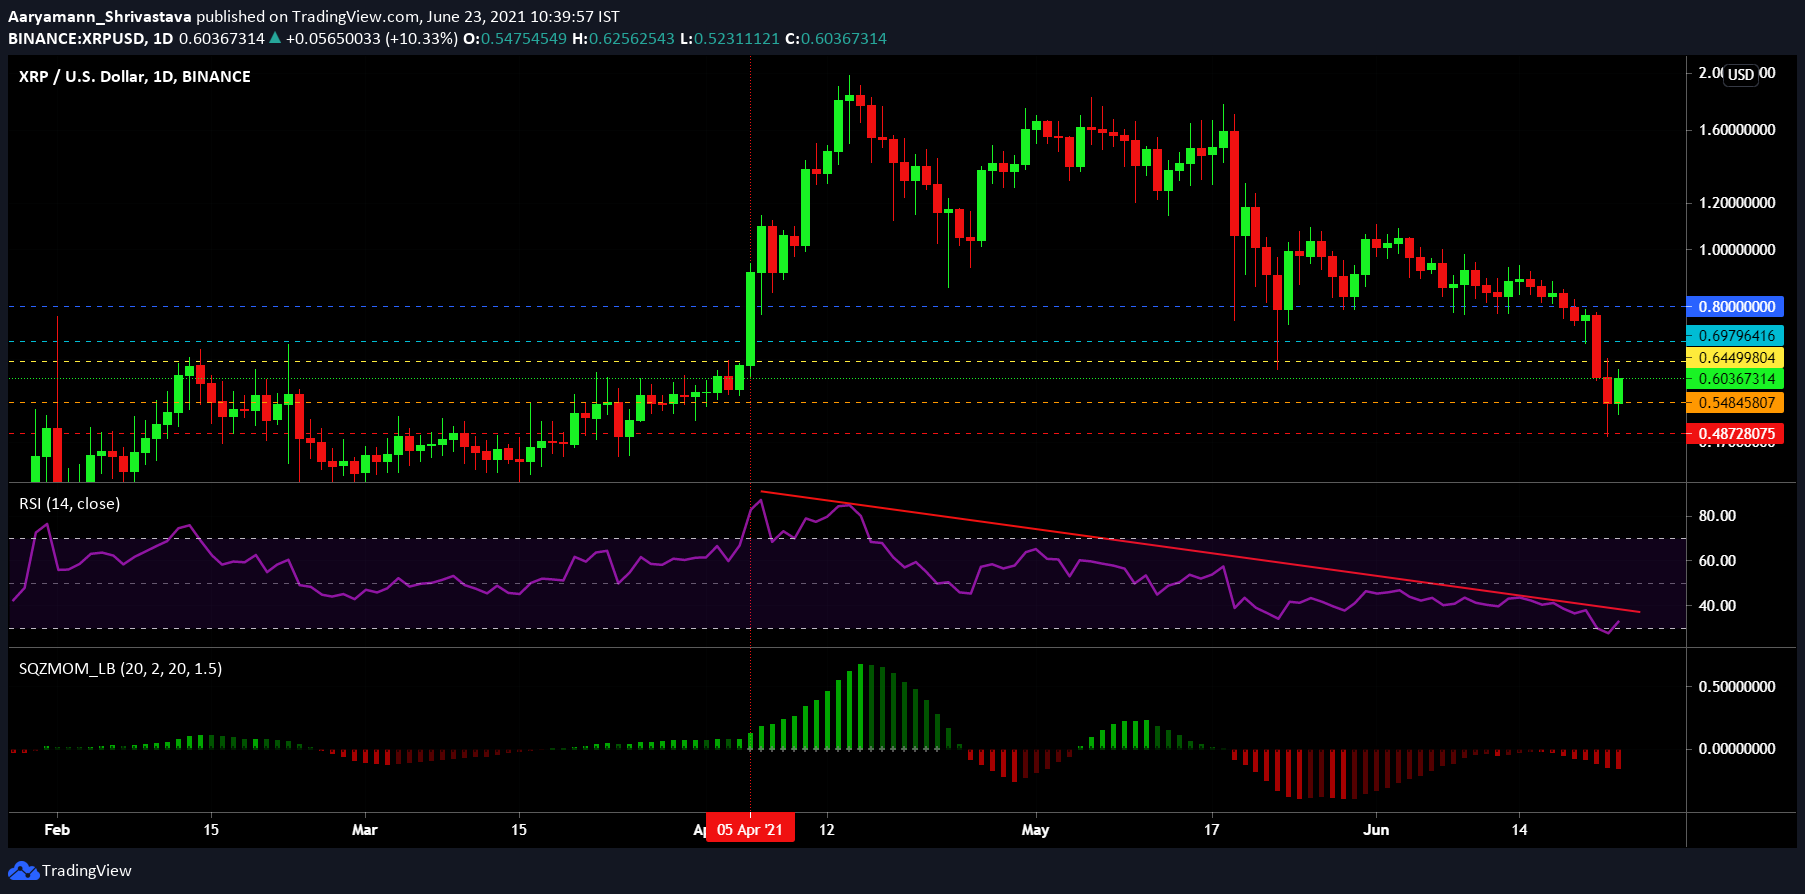
On the 24-hour chart, XRP bounced back from its $0.548 support level. However, broader market cues did not seem to be in favour of a bull run. At the time of writing, XRP was trading at $0.603. In less than 10 days, the coin fell through 3 support levels and established a critical support level at $0.48.
The Relative Strength Index [RSI] has been consistently dropping since the first week of May, falling into the oversold region on 21 June. At press time, the purple line indicator did note a small uptick, however, exhibiting some optimism for the indicator.
The Squeeze Momentum Indicator pictured bearish pressure being dominant on the indicator. The indicator continued to be in a squeeze (black dots), at press time. For the coin to recover the squeeze, a release should take place when bullish pressure rises.
Despite the green candle, the altcoin can swing either way going forward. Thus, $0.644 & $0.548 remain key levels in the short term.
Dogecoin [DOGE]
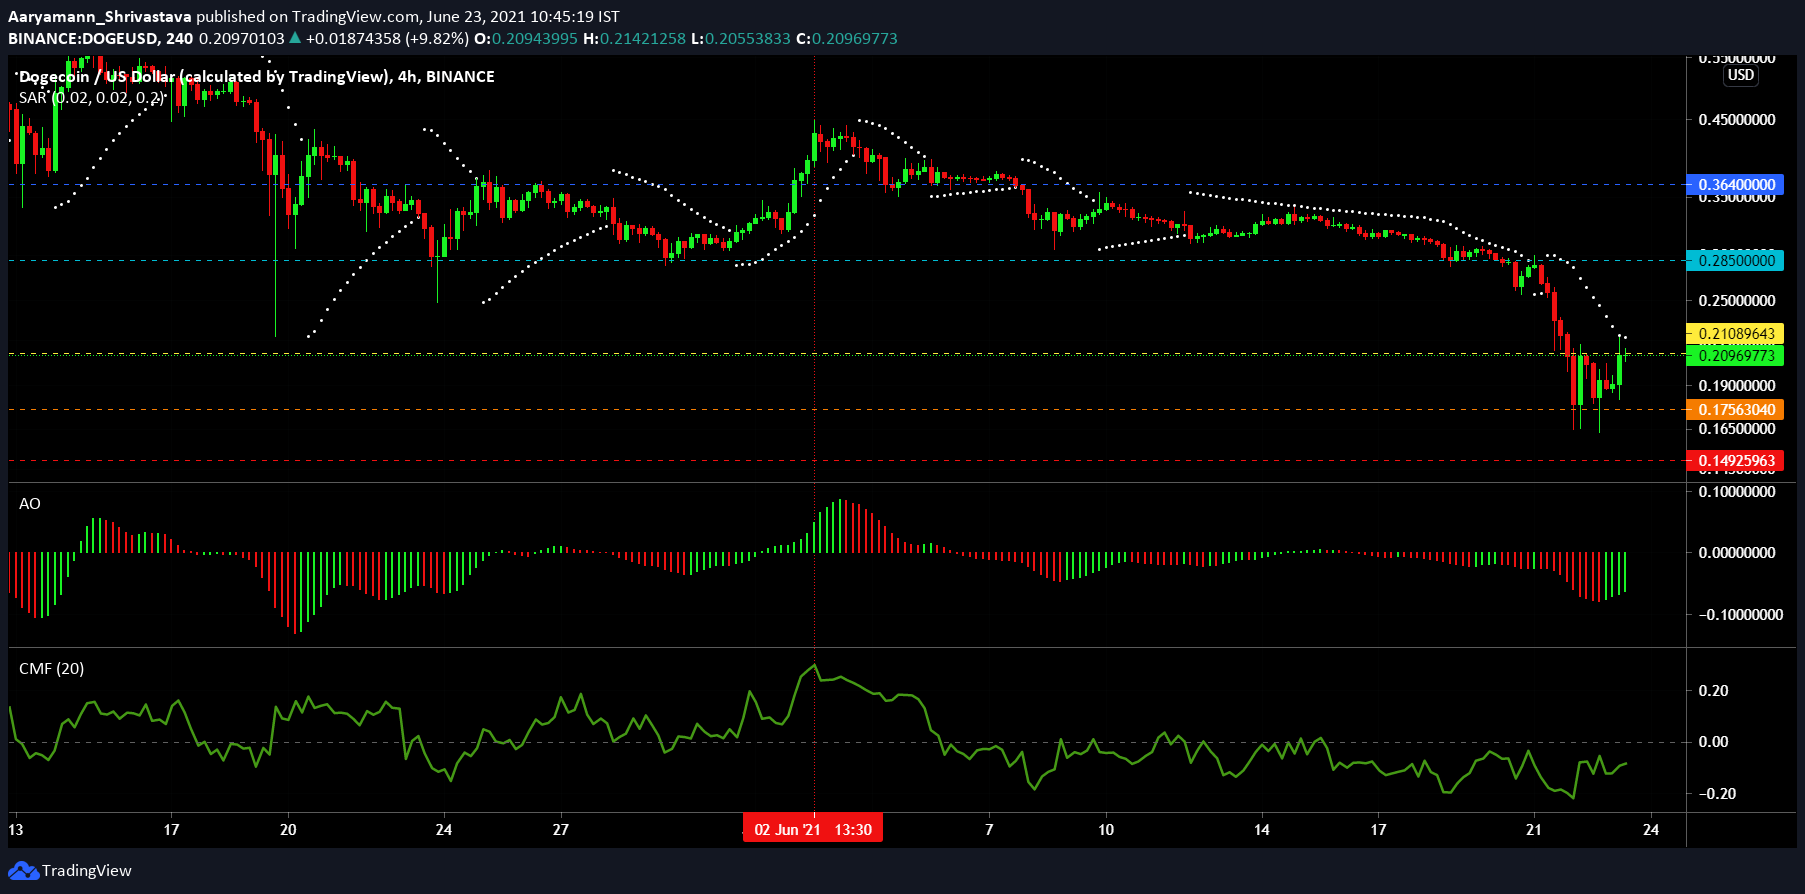
Dogecoin’s charts pictured some bullish movement on the 4-hour chart on 23 June. The price indicator could be seen heading towards flipping the $0.21-resistance level into support. The Parabolic SAR registered an active downtrend at press time with the white dotted line still above the candlesticks. However, with the coin trading at $0.20, closing the gap between the indicator and candle, this trend could soon turn into an uptrend.
This observation was supported by rising bullish momentum on the Awesome Oscillator as green bars have been appearing for the last 12 hours. Finally, even though Chaikin Money Flow did not see extraordinary positive momentum, capital inflows kept the indicator close to zero in the bearish-neutral zone.
If DOGE manages to flip $0.21 into support, the next resistance level will be found at $0.285.
Polkadot [DOT]
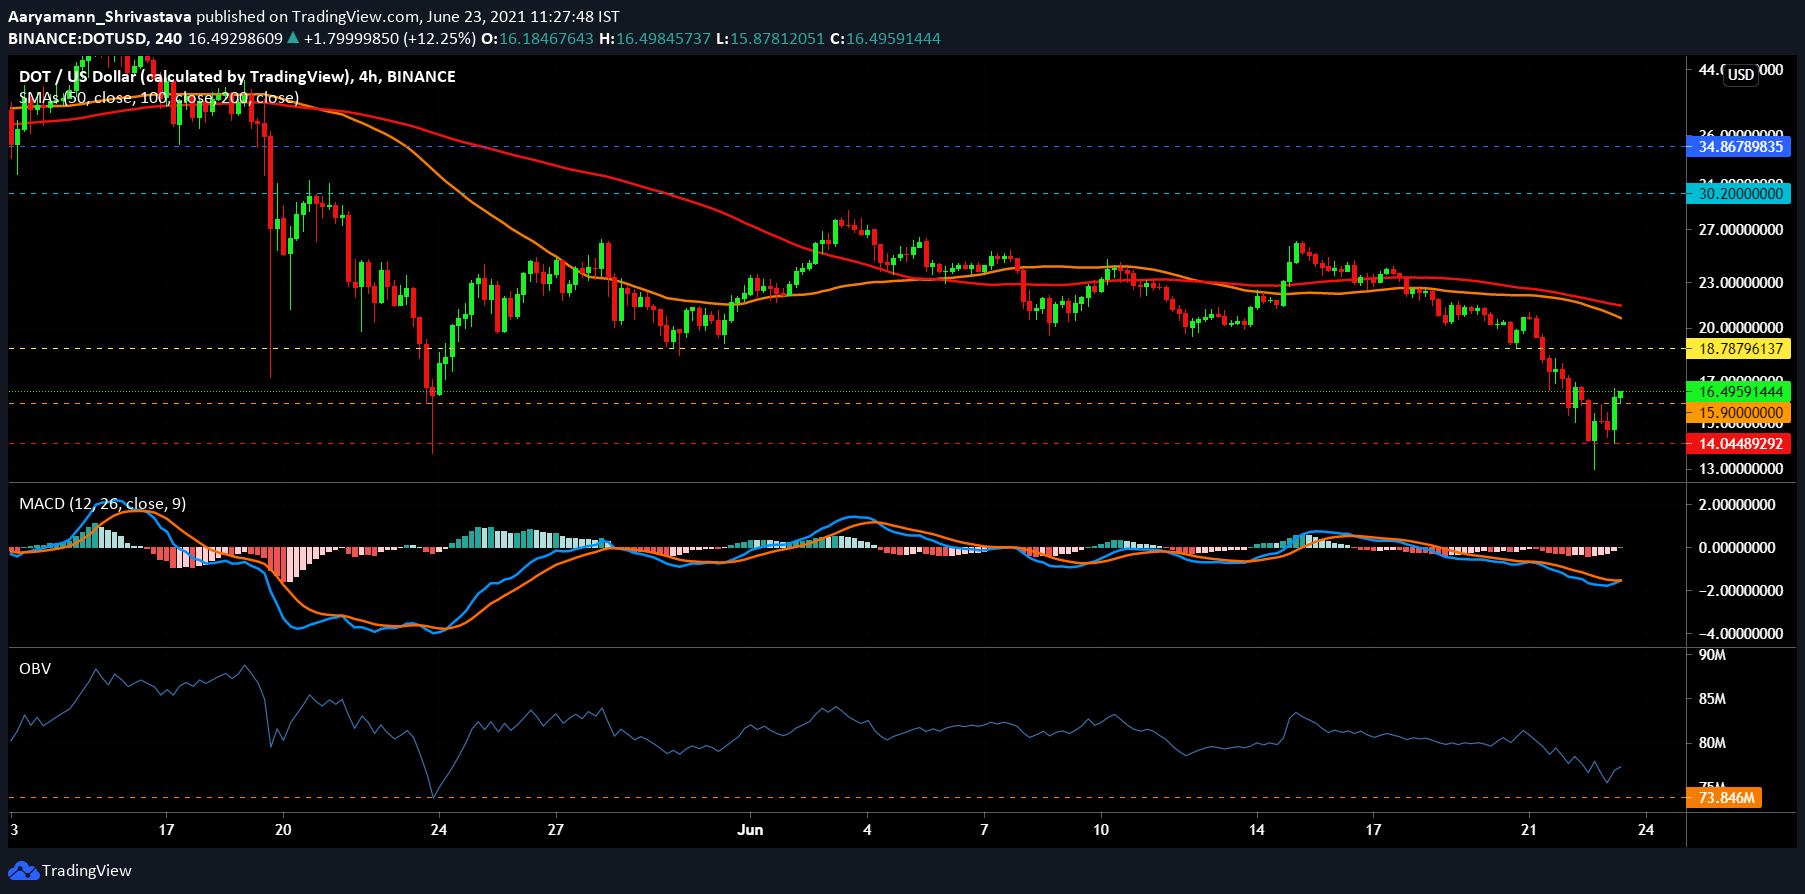
Some positive momentum helped Polkadot flip its $15.9 resistance into support, at the time of writing. DOT was trading at $16.49 and heading upwards, establishing $18.7 as the next resistance level. Despite being bearish at the time, the Simple Moving Average 50 SMA (orange) line displayed a minor downward heading. This movement, combined with the rising price in the long term could turn bullish for the coin. The 100 SMA (red) continued to be strongly bearish though.
The On Balance Volume saw persistent selling in the market as the blue line indicator continued its southbound trend. The indicator seemed to be already close to touching its May low. An uptick was observed at press time, however, and this could be a positive sign for the coin.
Finally, the MACD too saw positive signs as the indicator was on the cusp of a bullish crossover. The appearance of a green bar on the histogram suggested that momentum would pick up the pace soon.


