XRP, Ethereum Classic, Zcash Price Analysis: 11 January

After XRP lost the 61.8% Fibonacci support, the bulls needed to uphold the $0.729-level to prevent further crashes. After poking their multi-month lows in the last few days, Ethereum Classic and Zcash flashed a bearish bias in the near term.
XRP

XRP downturned from the $1.01-mark resistance and formed two down-channels on its 4-hour chart over the past 20 days. With the recent fall, the alt marked a 31.41% retracement and lost the vital 61.8% Fibonacci support.
Over the past four days, the alt retested the $0.7292-mark support multiple times while the 20 EMA (dark yellow) stood as a resistance point. As a result, the Squeeze Momentum Indicator flashed a low volatility phase. Now, the $0.7292-mark becomes crucial to uphold to prevent a fallout to $0.7.
At press time, XRP traded at $0.737. The RSI took a conflicting position by forming an up-channel. Nevertheless, it still struggled to cross the half-line.
Ethereum Classic (ETC)
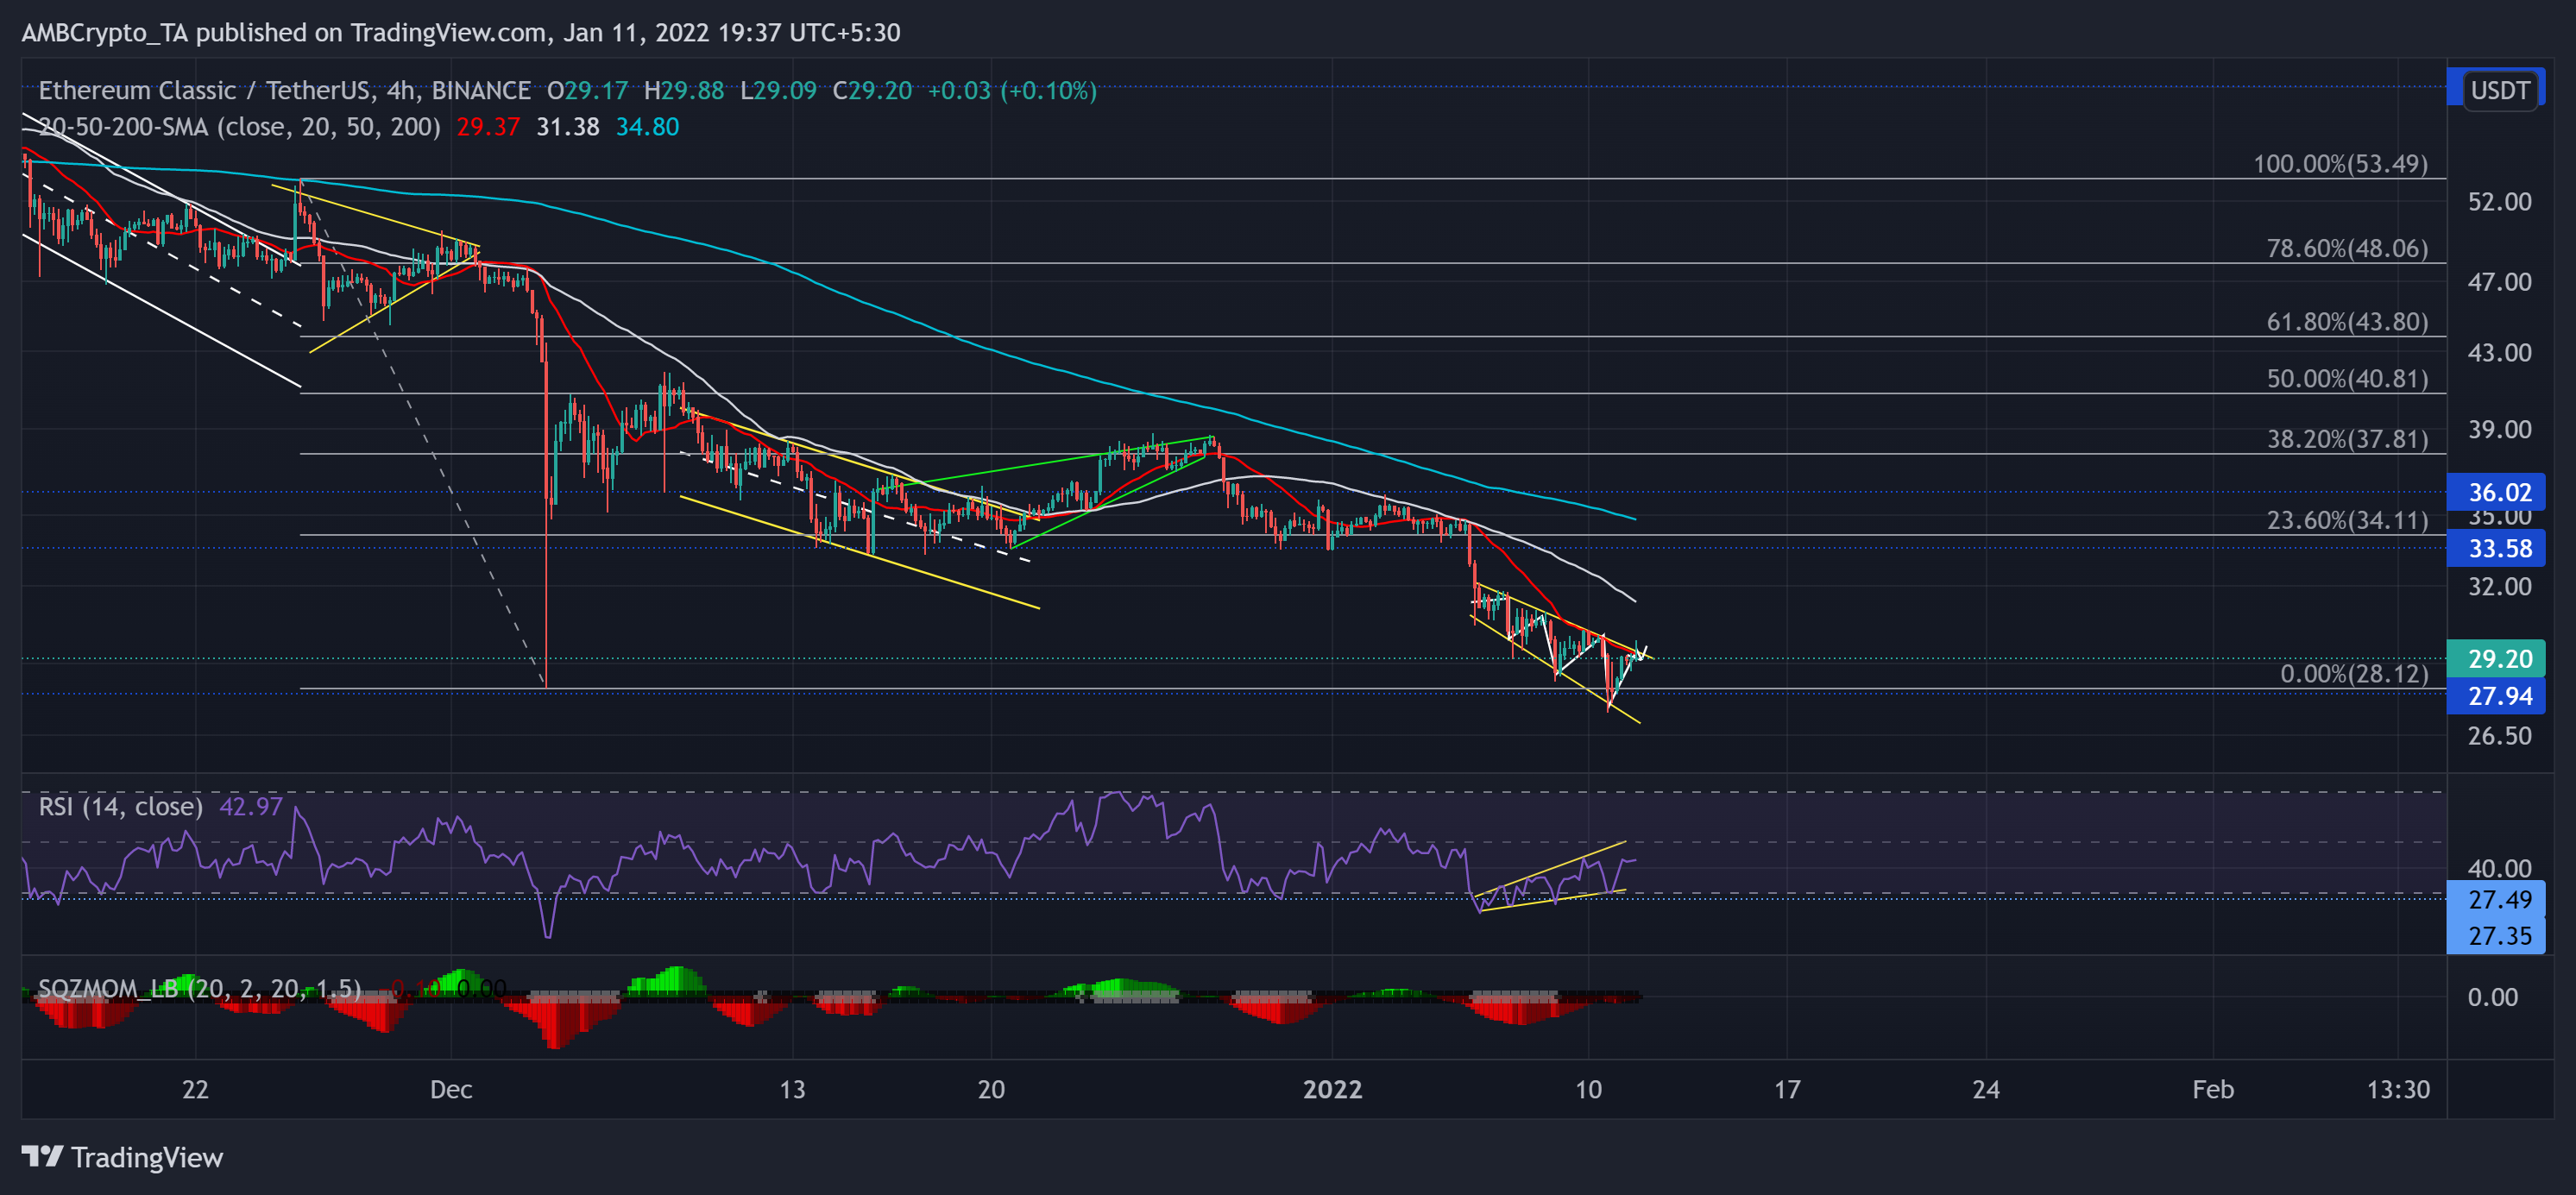
While the down-channel (yellow) found support at the $33-mark, a rising wedge reversal obliged the 38.2% Fibonacci resistance. After briefly oscillating between the $36 and $33-range near its Point Of Control (red), ETC succumbed to a broader sell-off.
It marked a 29.8% correction (from 27 December high) until it poked its 37-week low on 10 January. Now, ETC formed a descending broadening wedge (yellow, reversal pattern) and plunged below its 20-50-200 SMA. Upholding the $27.9-mark would be paramount for a potential breakout.
At press time, ETC traded at $29.2. The RSI showed improvement signs but still struggled to cross the half-line. On the other hand, the Squeeze Momentum Indicator continued to flash black dots, hinting at a low volatility phase.
ZCash (ZEC)
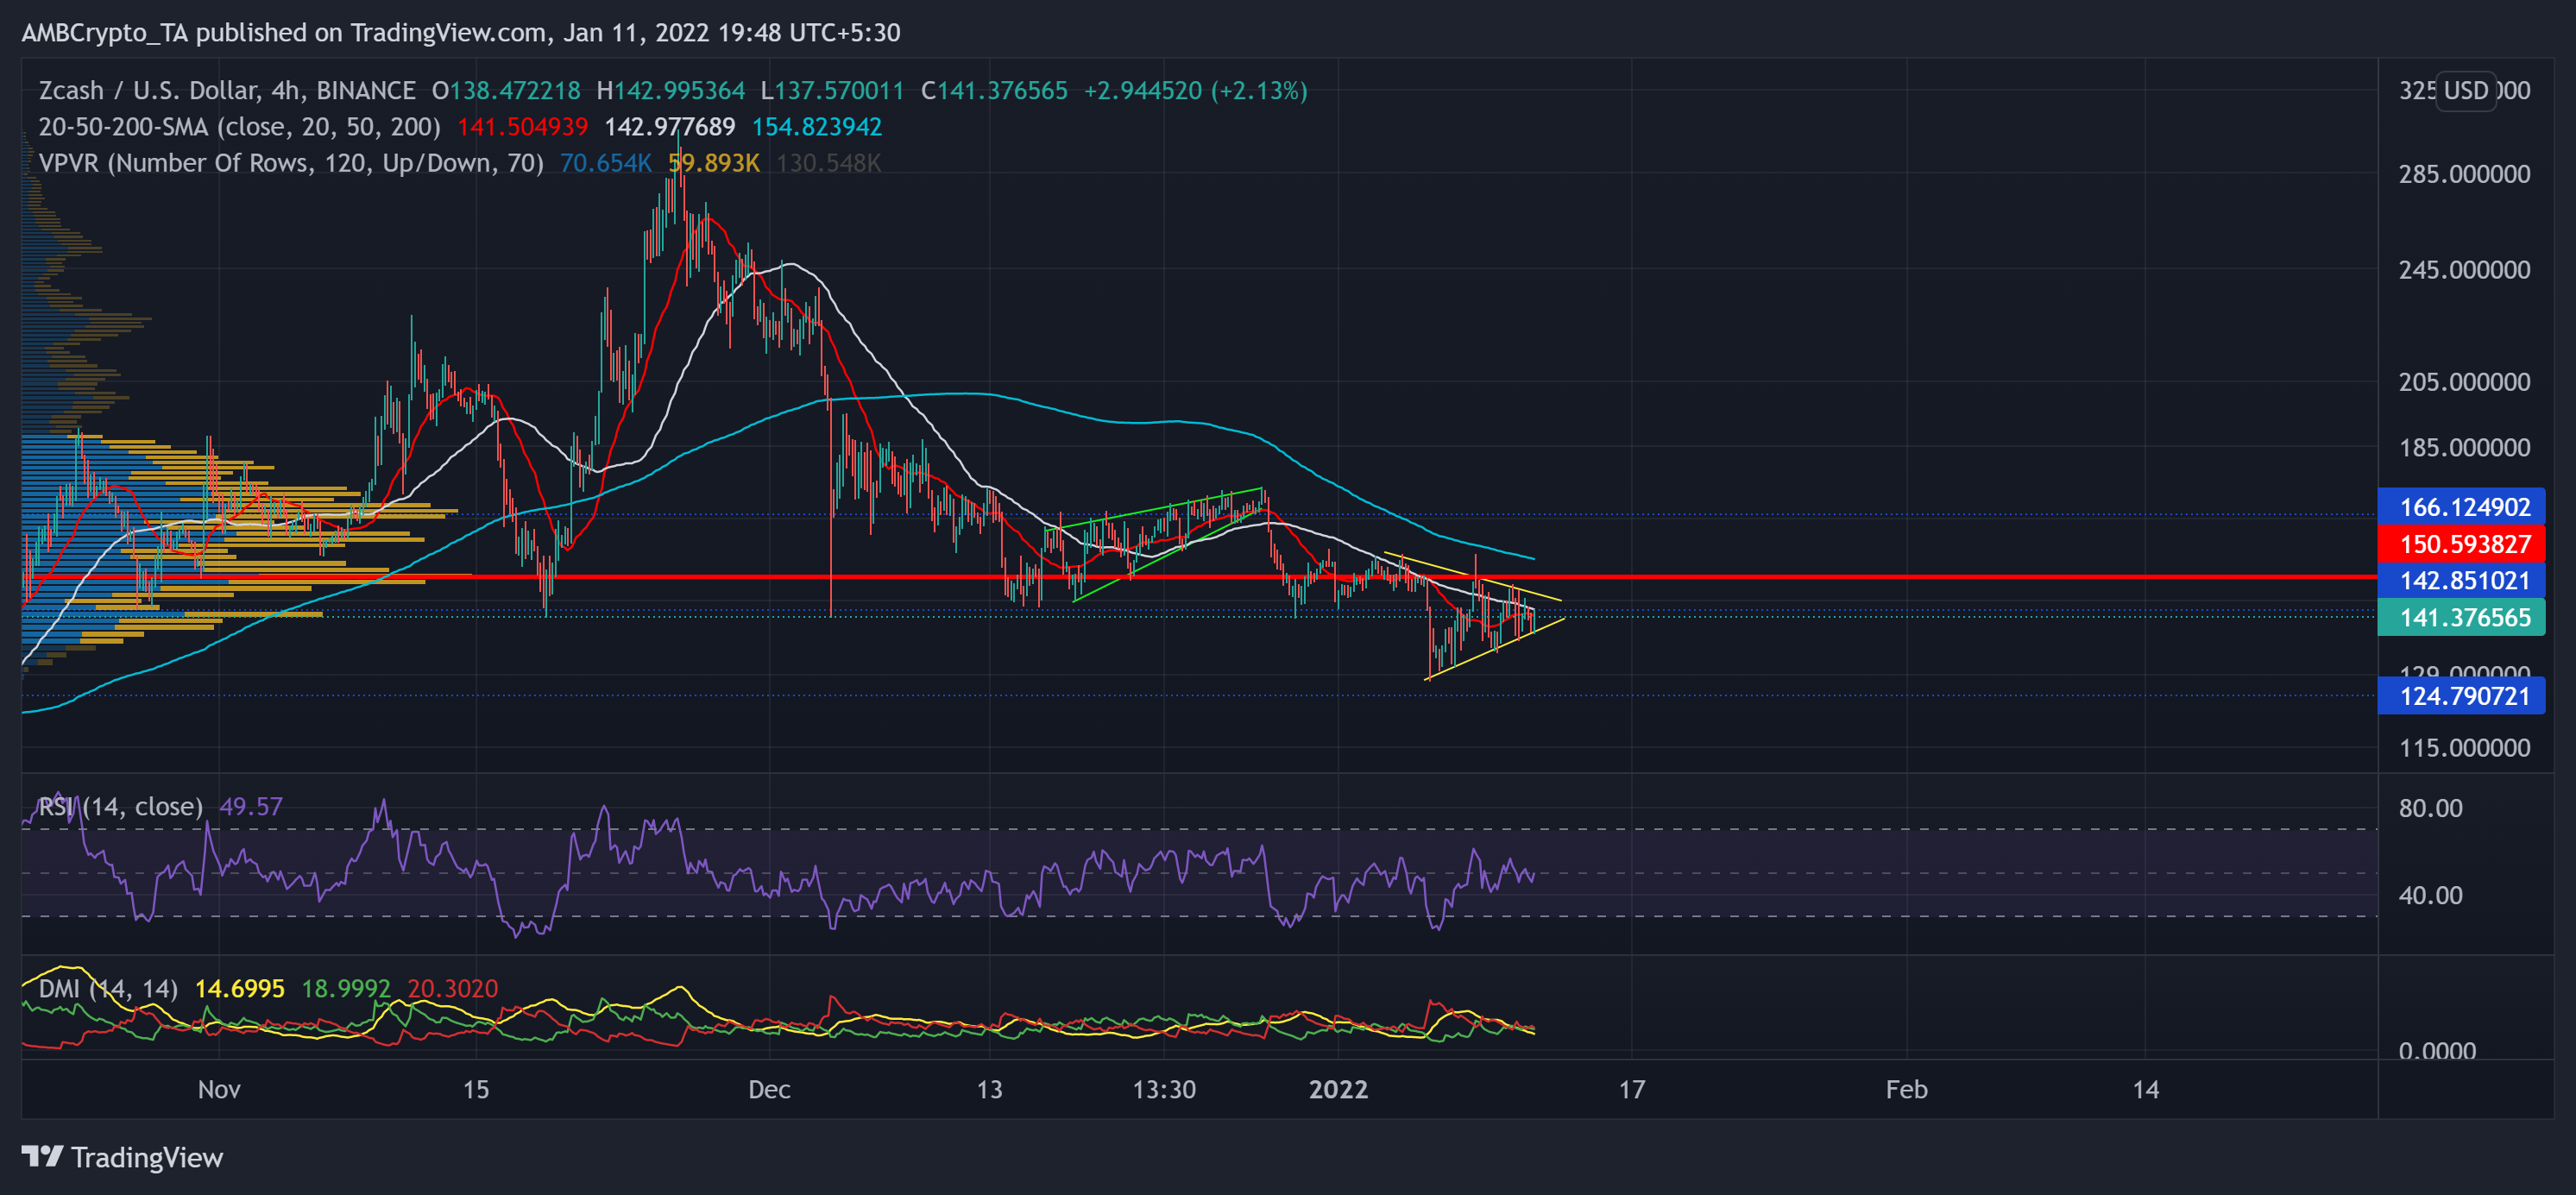
Over the past few days, ZEC formed a symmetrical triangle (yellow) on its 4-hour chart. After the rising wedge (green) saw a breakdown from the $166-resistance, the alt marked a 25.5% decline 11-week low on 6 January. The recent pushed the alt below its long-term Point of Control (red) and flashed a bearish bias.
At press time, ZEC traded 95.6% below its ATH at $141.37. The trading price was below the 4-hour 20-50 SMA while the RSI stood slightly below the half-line. These readings indicated a marginal preference for sellers. Additionally, the DMI chose the bears, but the ADX depicted a weak directional trend for ZEC.


