XRP flips $0.35 to support but could the bullish move have reached its apex?

Disclaimer: The findings of the following analysis are the sole opinions of the writer and should not be considered investment advice.
Bitcoin [BTC] faced resistance at the $24.2k mark and the bulls were rebuffed in their attempt to drive prices higher. Heading into the weekend, Bitcoin was struggling to climb back above the $23.6k area. The lower timeframe rejection and move back to $22.5k (6% drop) also affected altcoins over the past couple of days. XRP also posted a pullback of 6.7% over the same time period as it dipped from $0.377 to $0.352. Can a further pullback be expected going into the weekend?
XRP- 2-Hour Chart
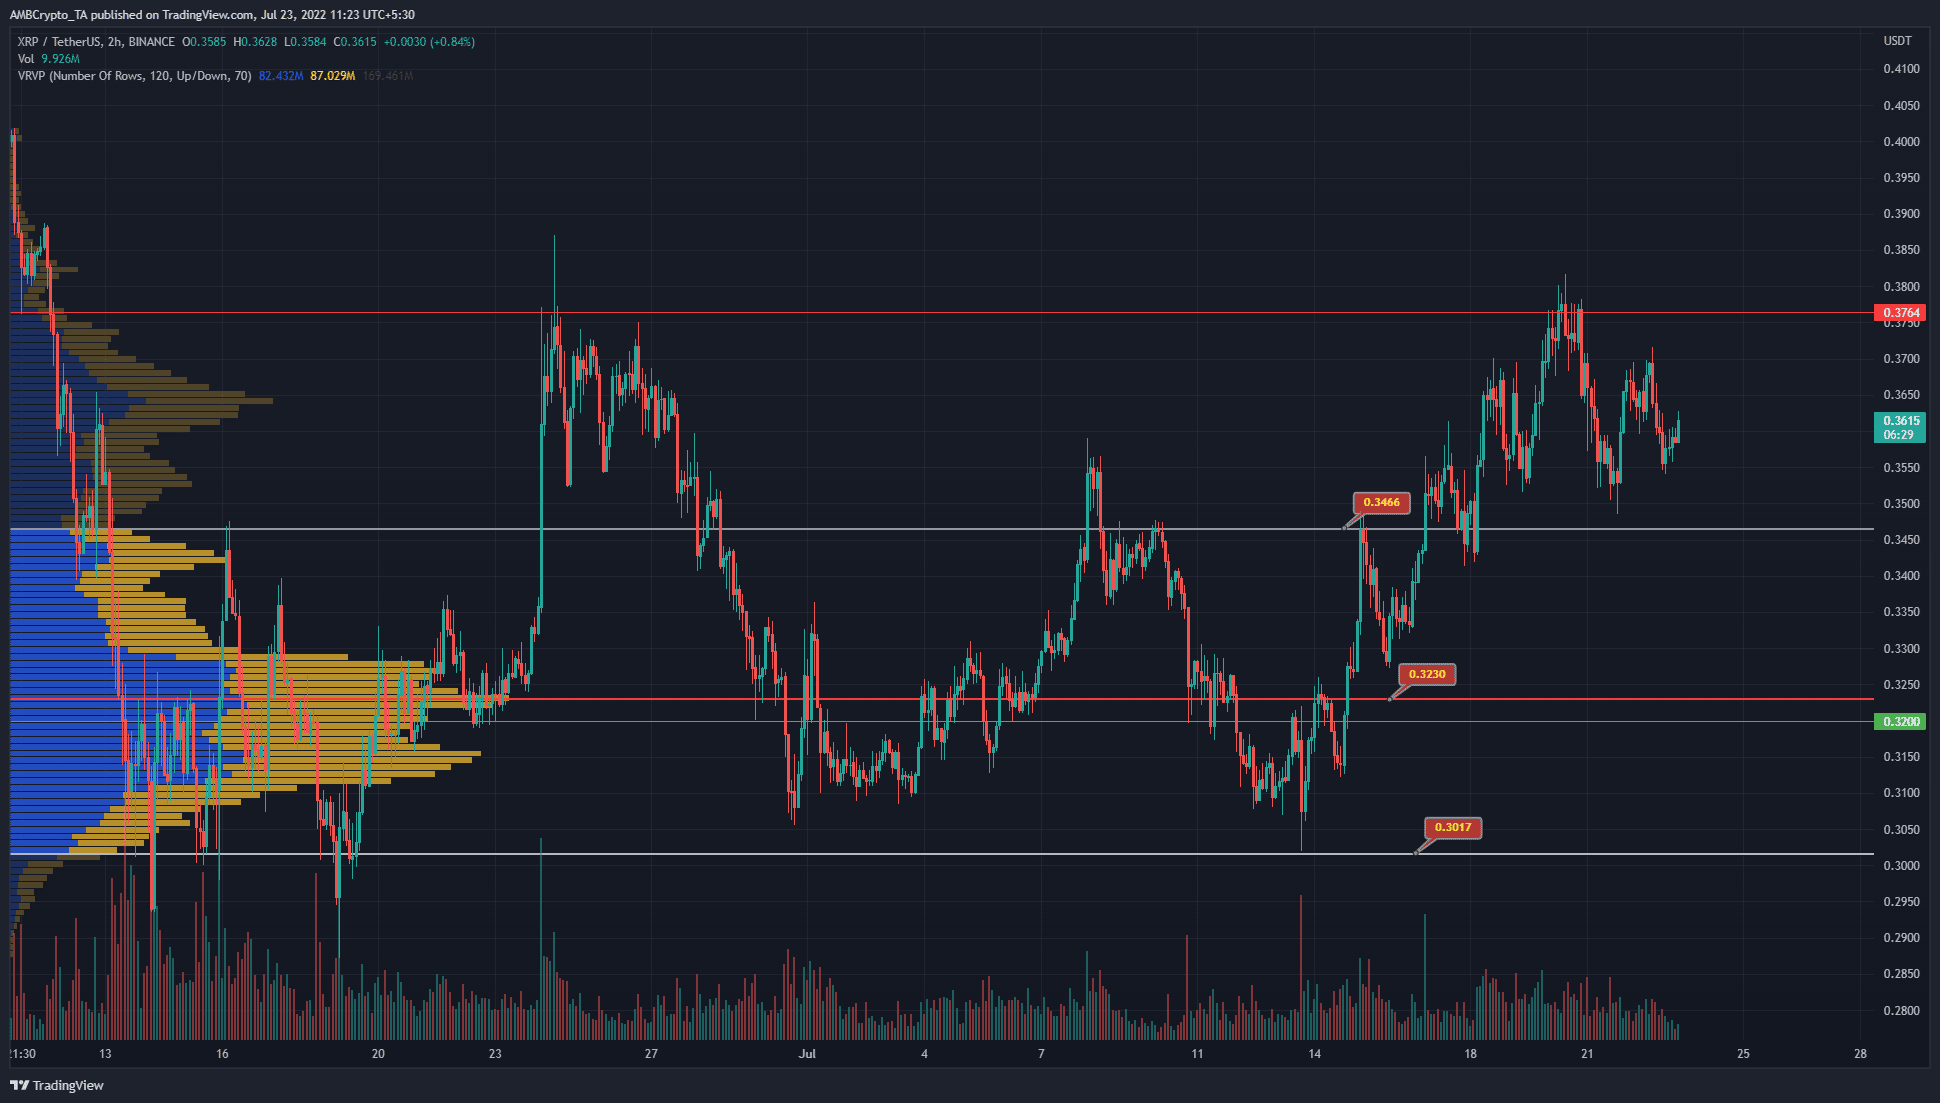
TheVolume Profile Visible Range showed the Value Area High and Value Area Low (white) to lie at $0.3466 and $0.3 respectively. The Point of Control (red) was at $0.32. The buyers would take encouragement from the fact that the price has flipped the VPVR VAH to support.
However, the price has marginally dipped beneath the lower timeframe higher low of the uptrend at $0.353 to reach $0.352. XRP has also set a lower high over the past few days after the rejection at $0.376.
Was this a sign that the momentum began to favor the bears again, or was this indicative of a pullback to support before a move higher?
Rationale
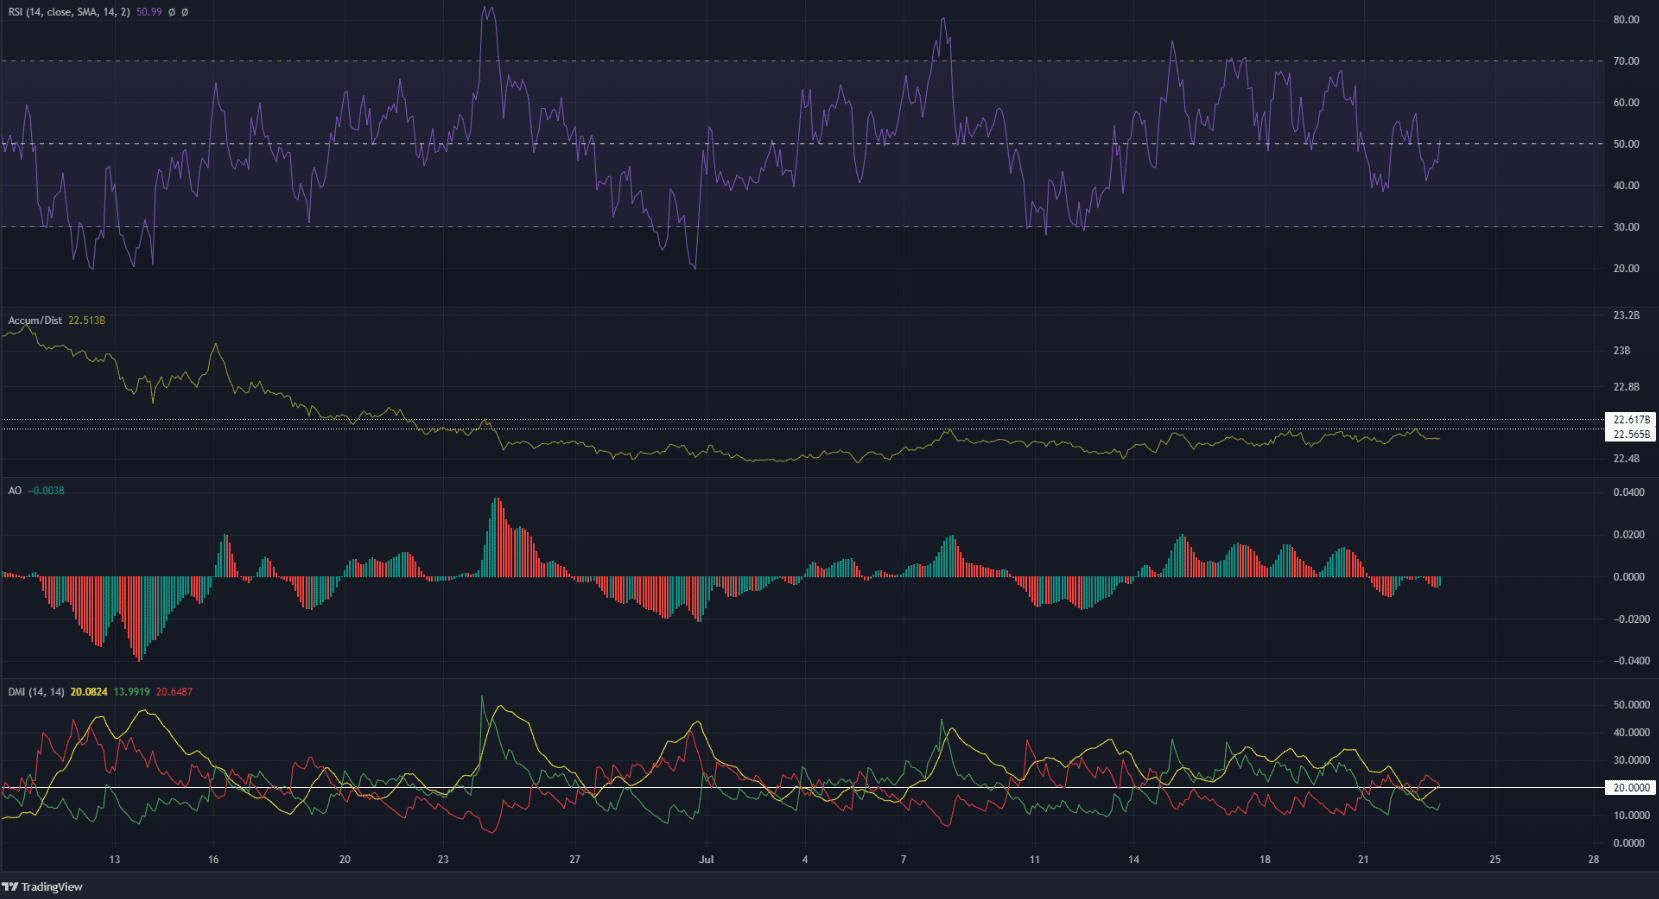
The Relative Strength Index (RSI) was not conclusive over the past few days. In the past week, the RSI held neutral 50 as support, but this level failed recently. Therefore, some choppy momentum could ensue over the weekend. Similarly, the Awesome Oscillator (AO) was also below the zero level. It did not yet show strong bearish momentum.
The A/D line had a zone of resistance that was directly overhead, demarcated by the two dotted white lines. If the A/D can push past this region, it would be a sign of steady demand behind the XRP rally.
The Directional Movement Index (DMI) highlighted a lack of a strong trend. The ADX (yellow) was at 20, and the -DI was barely above the 20 mark. Technically this indicated a bearish trend, but overall it signified the lack of a significant trend over the past few days.
Conclusion
The $0.35-$0.36 region would be important for the bulls to defend over the next day or two. The formation of a lower low below this region would signal bearish strength. The momentum indicators were inconclusive on the lower timeframes. Bitcoin could heavily influence the direction of XRP in the near future as well.


