Analysis

XRP, GALA, and Shiba Inu Price Analysis: 14 May
Posted:
| Last updated: January 30th, 2024
Journalist

BTC/USD Long positions on Bitfinex skyrocketed in the past couple of days and encouraged traders to believe that the local bottom was in for Bitcoin. BTC did indeed bounce from $28.8k to $30.8k but fell once more to trade at $29.3k at press time. The altcoin market followed in Bitcoin’s footsteps on the chart.
XRP
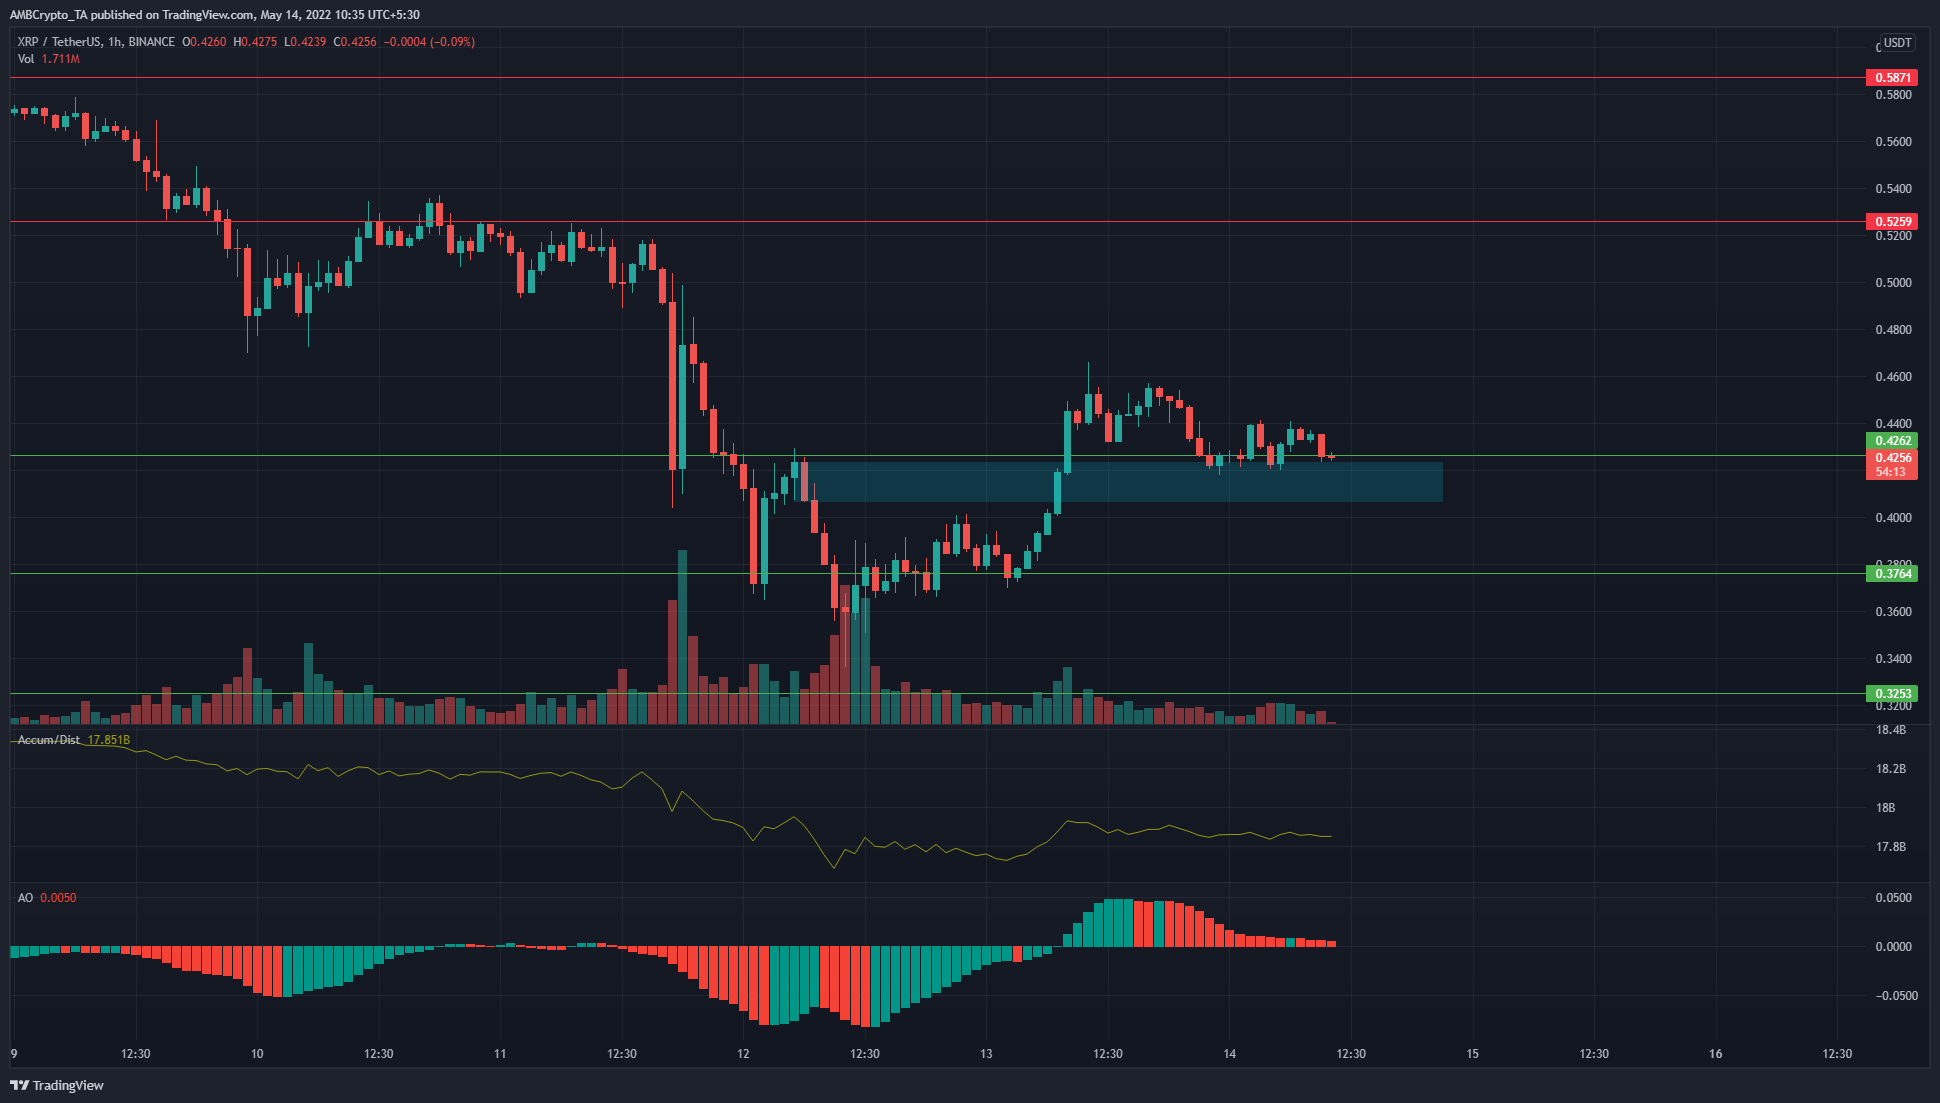
Source: XRP/USDT on TradingView
XRP climbed past the bearish order block in the $0.4 area and appeared to have flipped it from supply to a demand zone (cyan box). Moreover, the price also has a support level at the $0.42 mark.
Over the weekend, it is possible that XRP could make a move upward from the confluence of demand zone and support. However, some buying volume needs to be seen, but as things stand the A/D indicator was moving flat to show that neither bears nor bulls had the upper hand in the past few hours. The Awesome Oscillator also hovered just above the zero line at press time.
Gala (GALA)
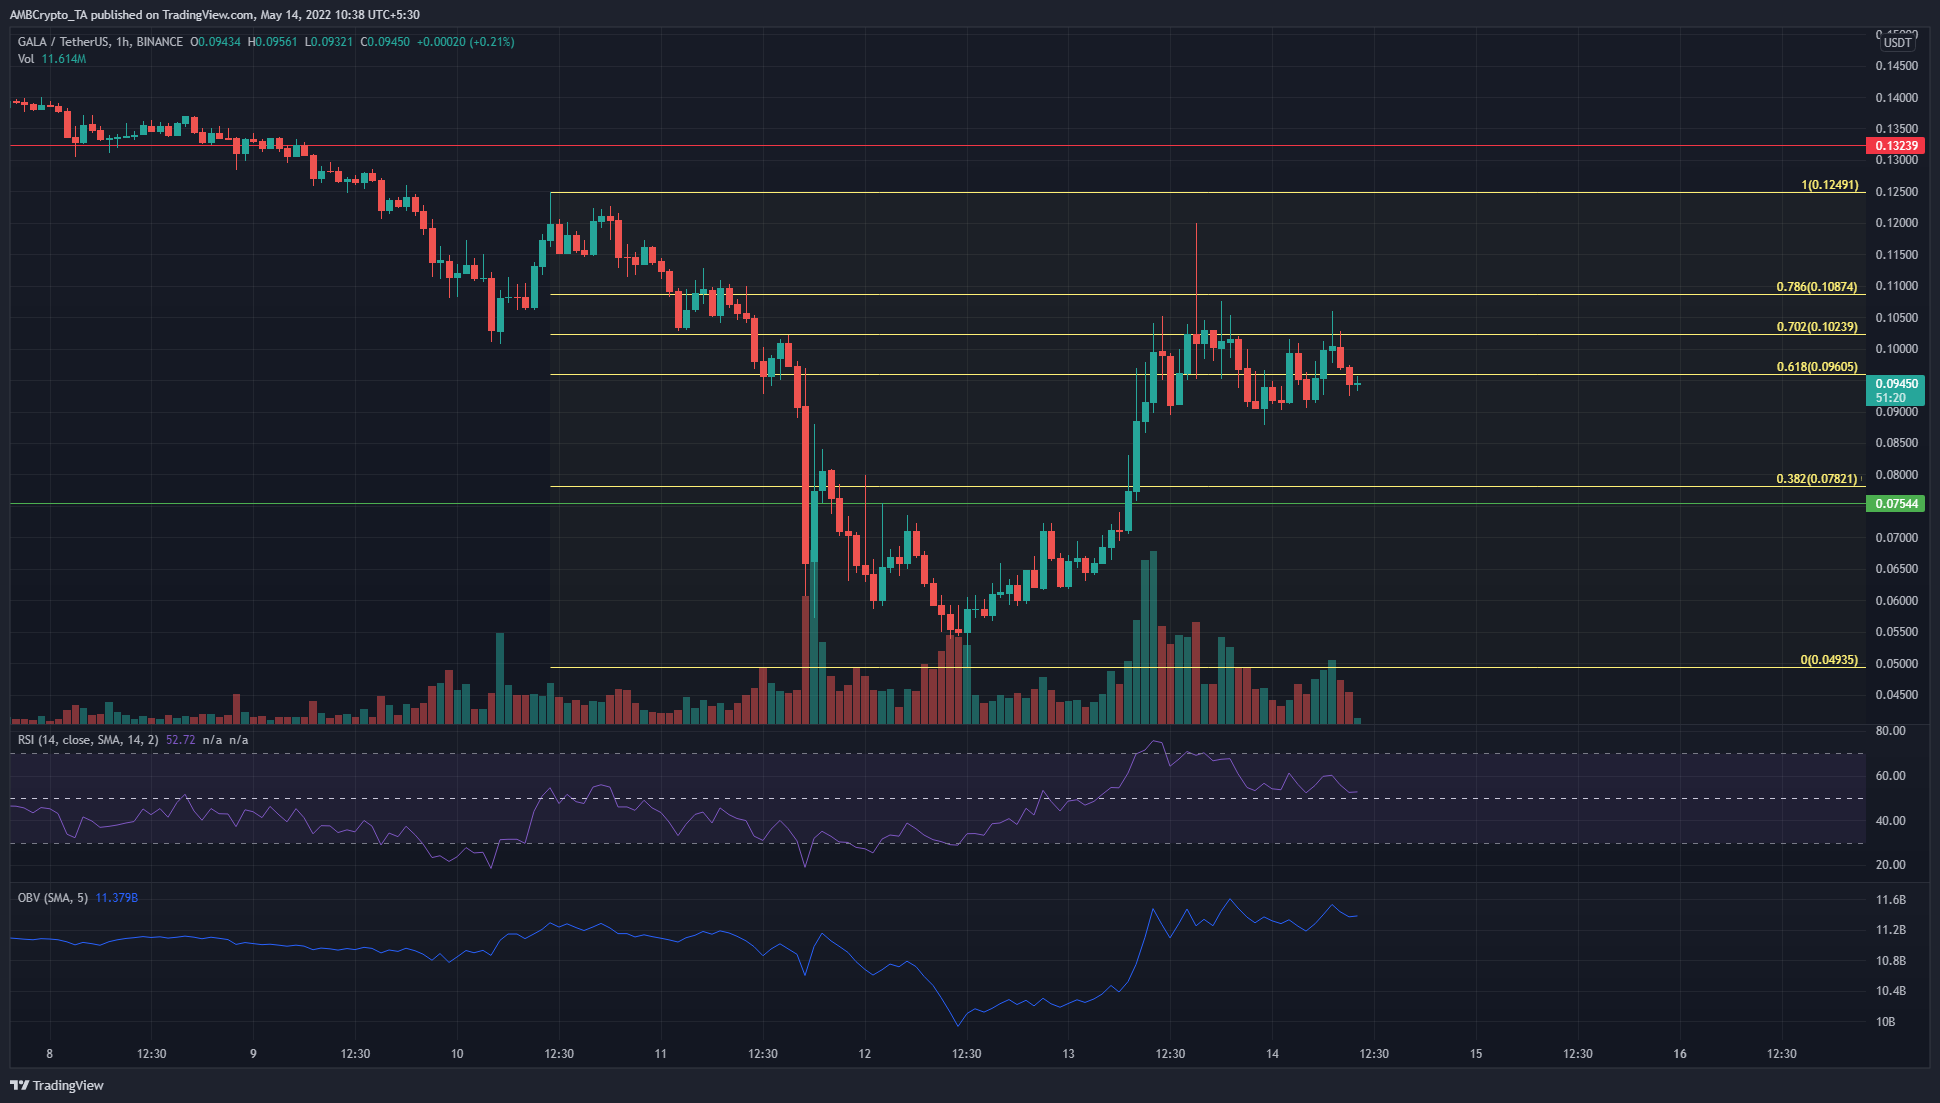
Source: GALA/USDT on TradingView
Even though GALA registered a nearly 85% gain from the $0.54 lows it reached a couple of days ago, the trend remains bearish for the altcoin on the lower timeframes. The Fibonacci retracement levels highlighted the $0.096-$0.108 area to be a strong resistance zone.
To add to the bearish thesis, the long upper candlewick to $0.12 the previous day showed that the bulls have been rebuffed, but can sellers continue to drive the downtrend? The OBV has picked up significantly in the past couple of days, and the RSI also rose above neutral 50 to show a slightly bullish bias. However, unless $0.108 is flipped to support, a bearish bias is warranted.
Shiba Inu (SHIB)
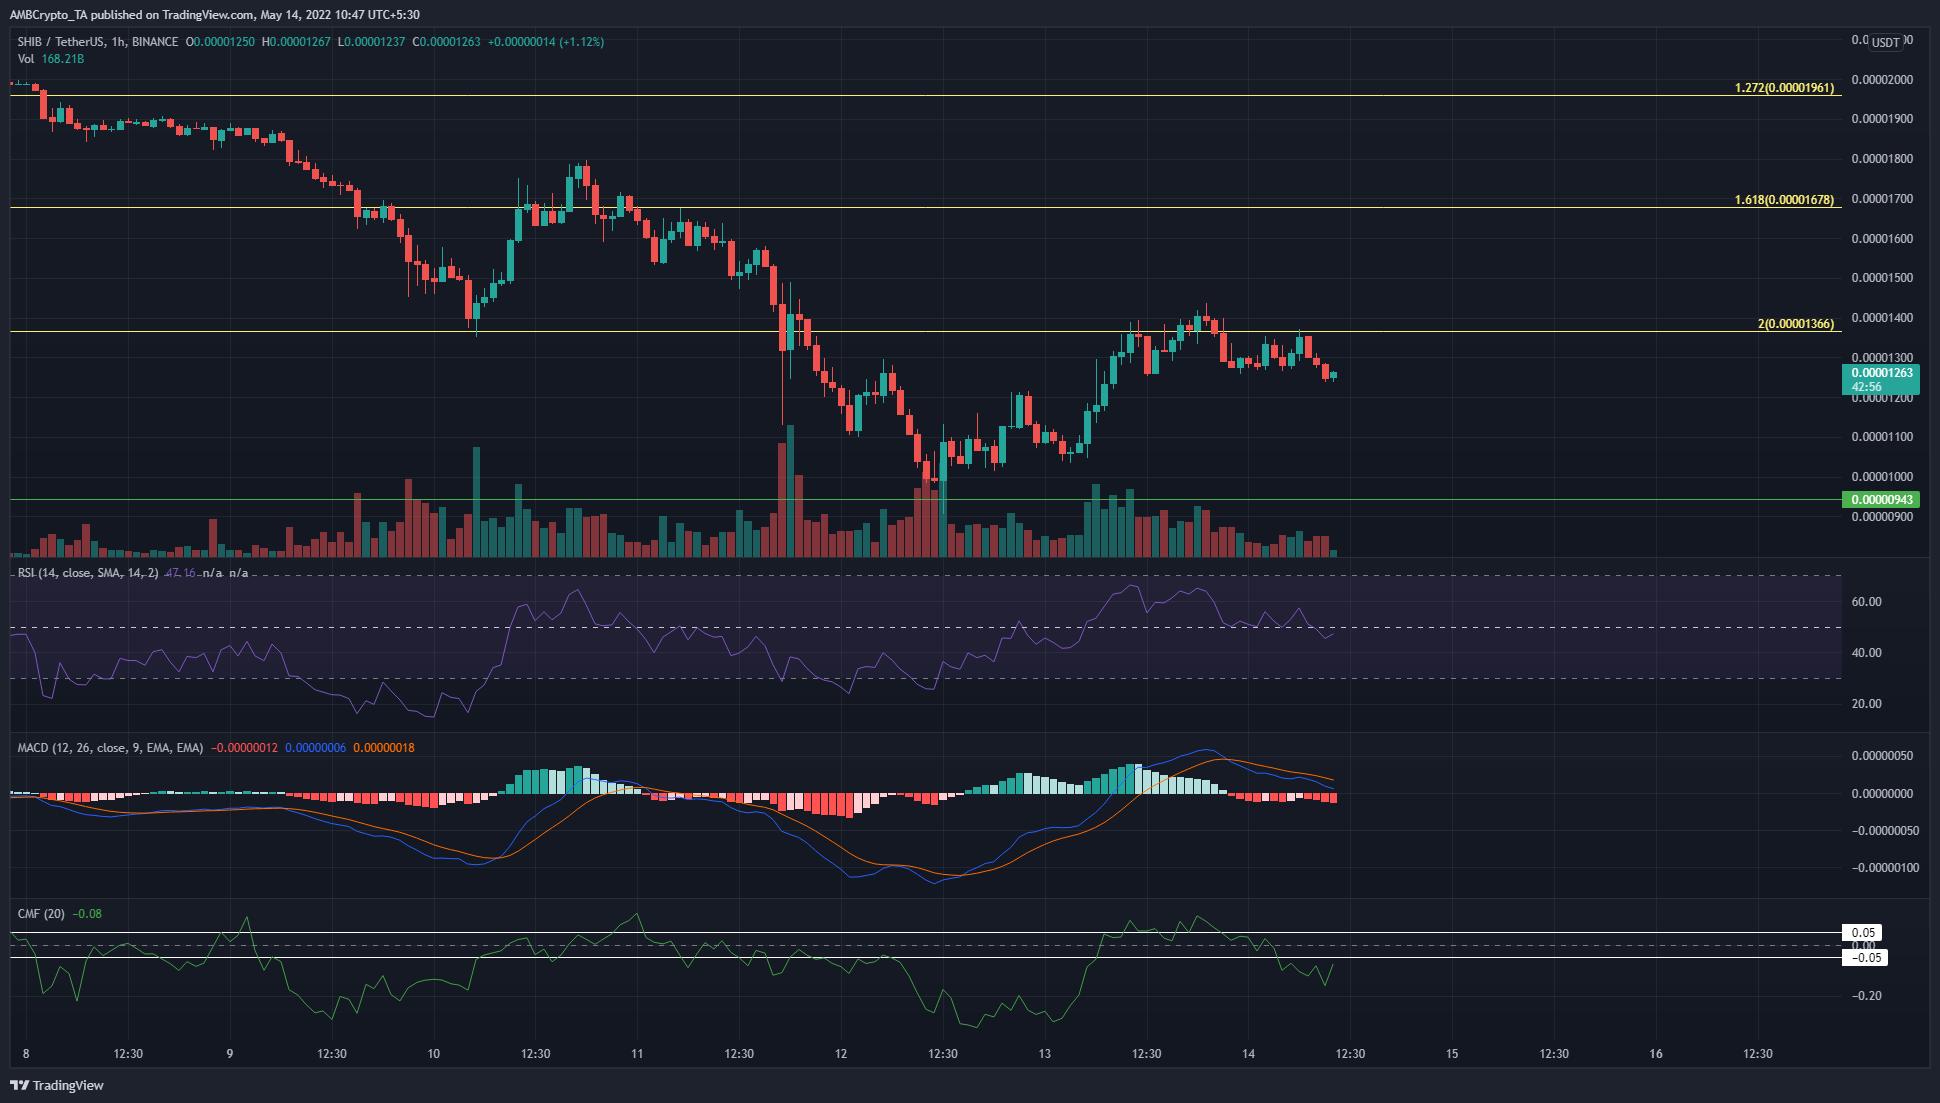
Source: SHIB/USDT on TradingView
Shiba Inu continued to descend down the price charts and the support level at $0.000009 could be revisited should Bitcoin take a tumble. The OBV did not show sufficient demand to reverse the downtrend, while the MACD indicator fell toward the zero line to show waning bullish momentum.
The RSI fell below the neutral 50 line to show a possible shift in momentum toward the bearish side again. Alongside, the CMF slipped below -0.05 to indicate significant capital flow out of the market.