XRP has to find strong demand at this key level to keep bears at bay

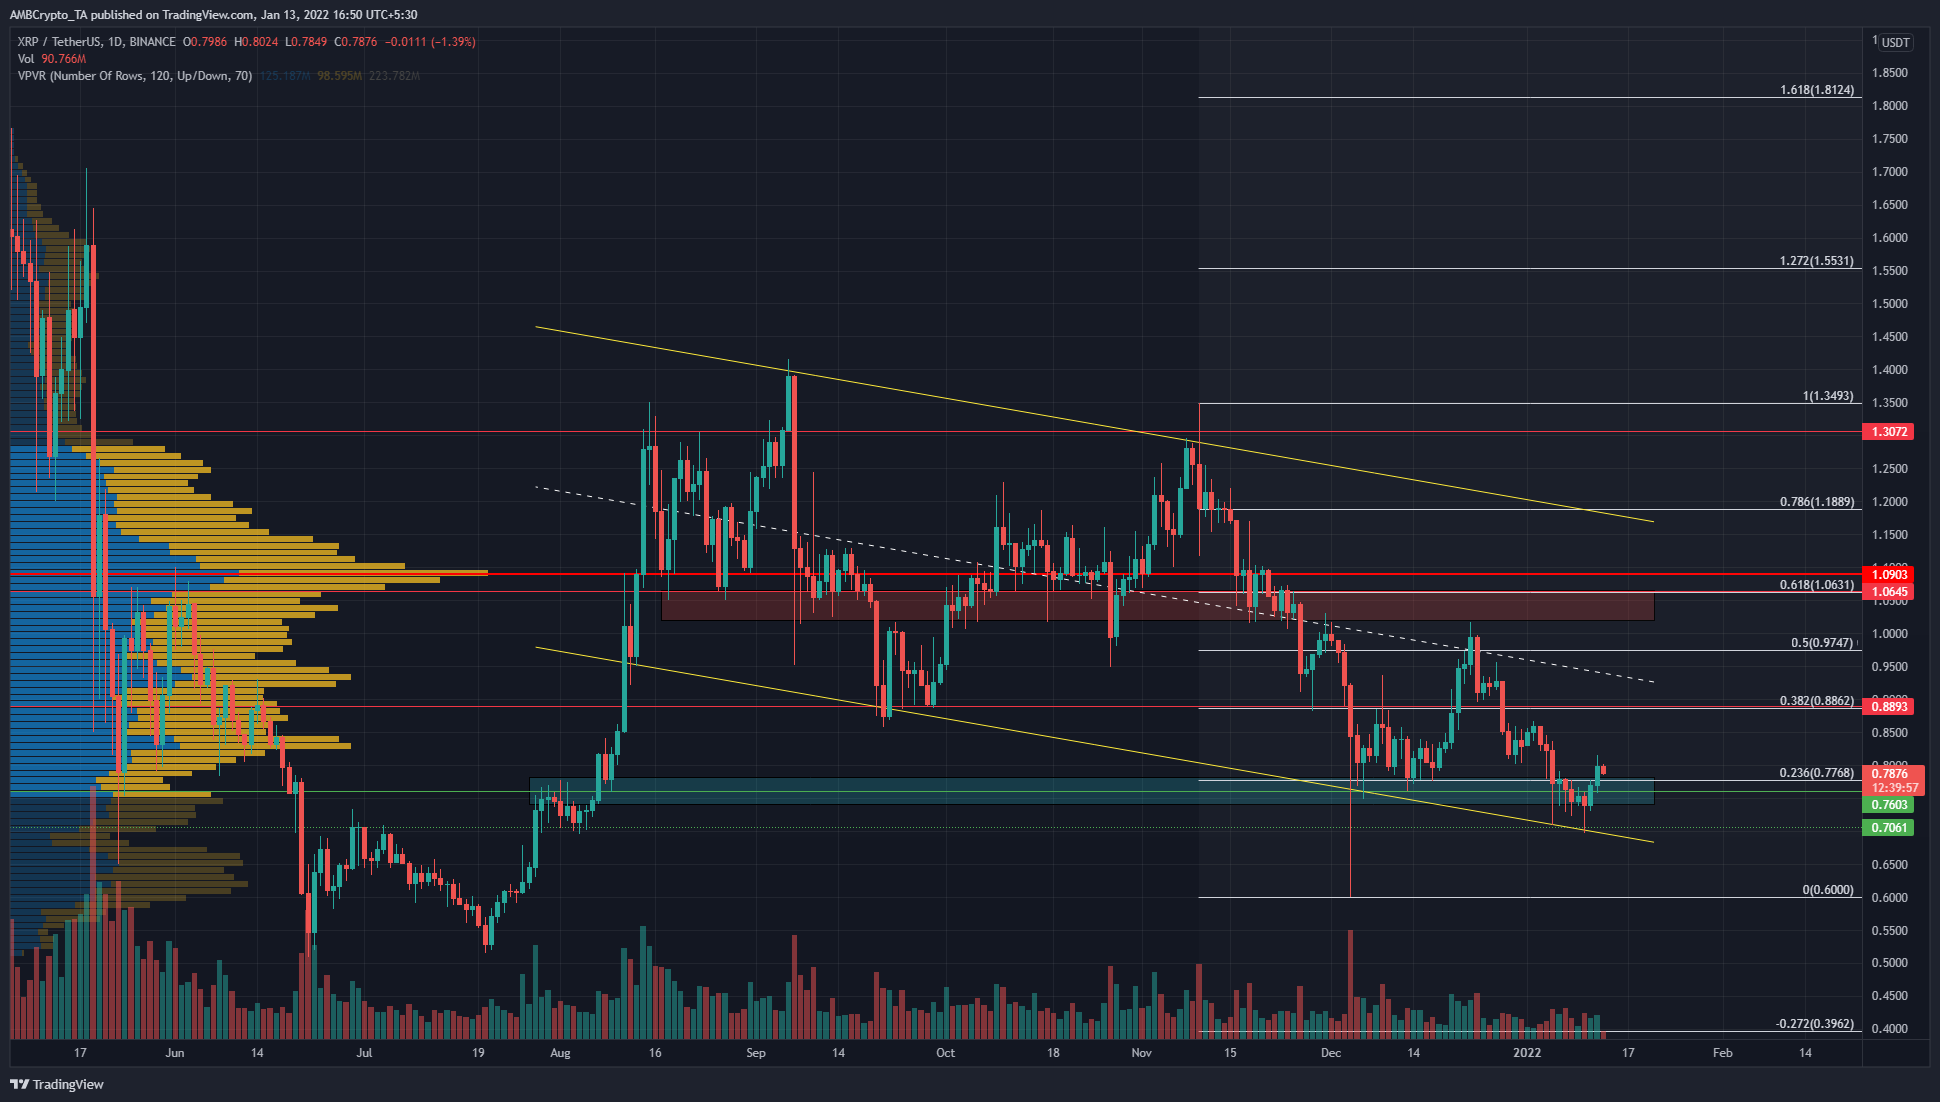
XRP held on to the $0.76 support level, although it did see a candle wick on the daily as far south as $0.705. This dip was bought. But, the question was- How many more dips can buyers absorb? The trend for XRP has been bearish on higher timeframes. A move past $0.9 would be needed to break the structure, but sellers were strong all the way up to $1.05. It appeared that XRP would need to beat multiple strong resistances before investors can expect a bullish run.
XRP- 1D

Source: XRP/USDT on TradingView
On the daily chart, a descending channel (yellow) was seen. In particular, the lower half of the channel has been respected well by the price. The channel lows coincided with support at $0.76 and some demand at $0.706 (dotted green line).
The strong gains in August came after the $0.76 area was flipped from supply to demand. At the time of writing, this area had not been flipped back to demand. But, it could only be a matter of time.
Repeated tests of a support level drain the buyers of capital and increase the likelihood that buyers would get exhausted and sellers can smash the price straight through the floor.
To the upside, there lay heavy resistance at $0.88 (Fibonacci retracement level and higher time frame resistance) and the $0.92-$0.94 area (a node of some strength on the Visible range Volume profile, combined with the channel’s midpoint). The $1 area (red box) was also an area where XRP had been rejected in the past couple of months.
Rationale

Source: XRP/USDT on TradingView
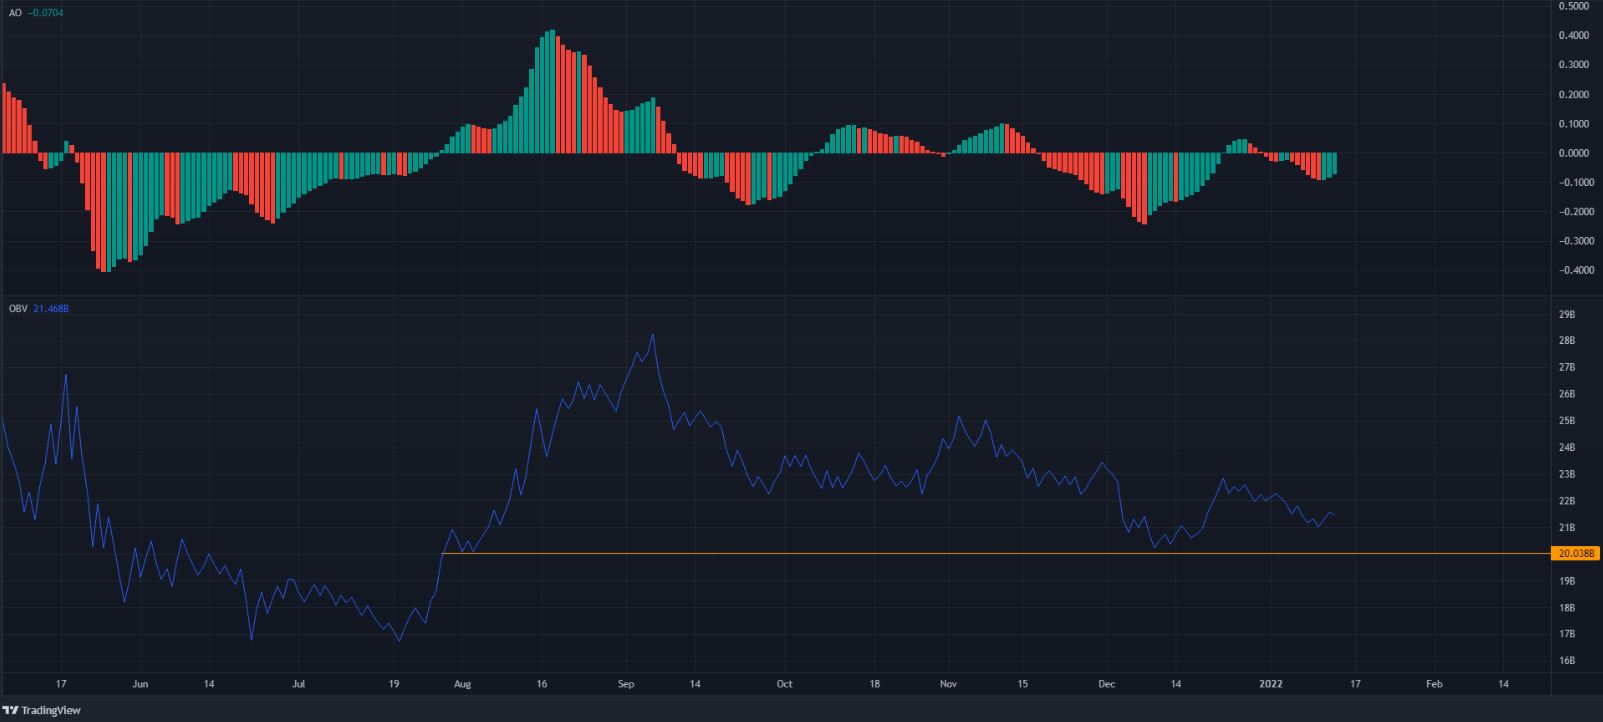
To break these resistances, the OBV has to steadily climb. It was encouraging that the OBV had not yet fallen below its August lows (before the most recent run past $1.3, but the lower highs formed on the OBV were ominous.
The Awesome Oscillator registered green bars to show bearish momentum was weakening but remained beneath the zero line.
Conclusion
XRP had far too much resistance to the north to contemplate buying XRP as a longer-term buy. However, an opportunity to short XRP between the $0.88-$1 area could arise, if there appeared signs of a move downward for Bitcoin.


