
XRP has been making steady gains since last month’s sudden drop in price, currently trending close to the $0.30 mark. Its market cap is currently over $12.8 billion and the trading volume over the last 24 hours was almost $1.9 billion, experiencing a 4.5% rise in the last day according to CoinMarketCap.
XRP was traded the most on the MXC exchange which was responsible for 5.18% of the overall trade.
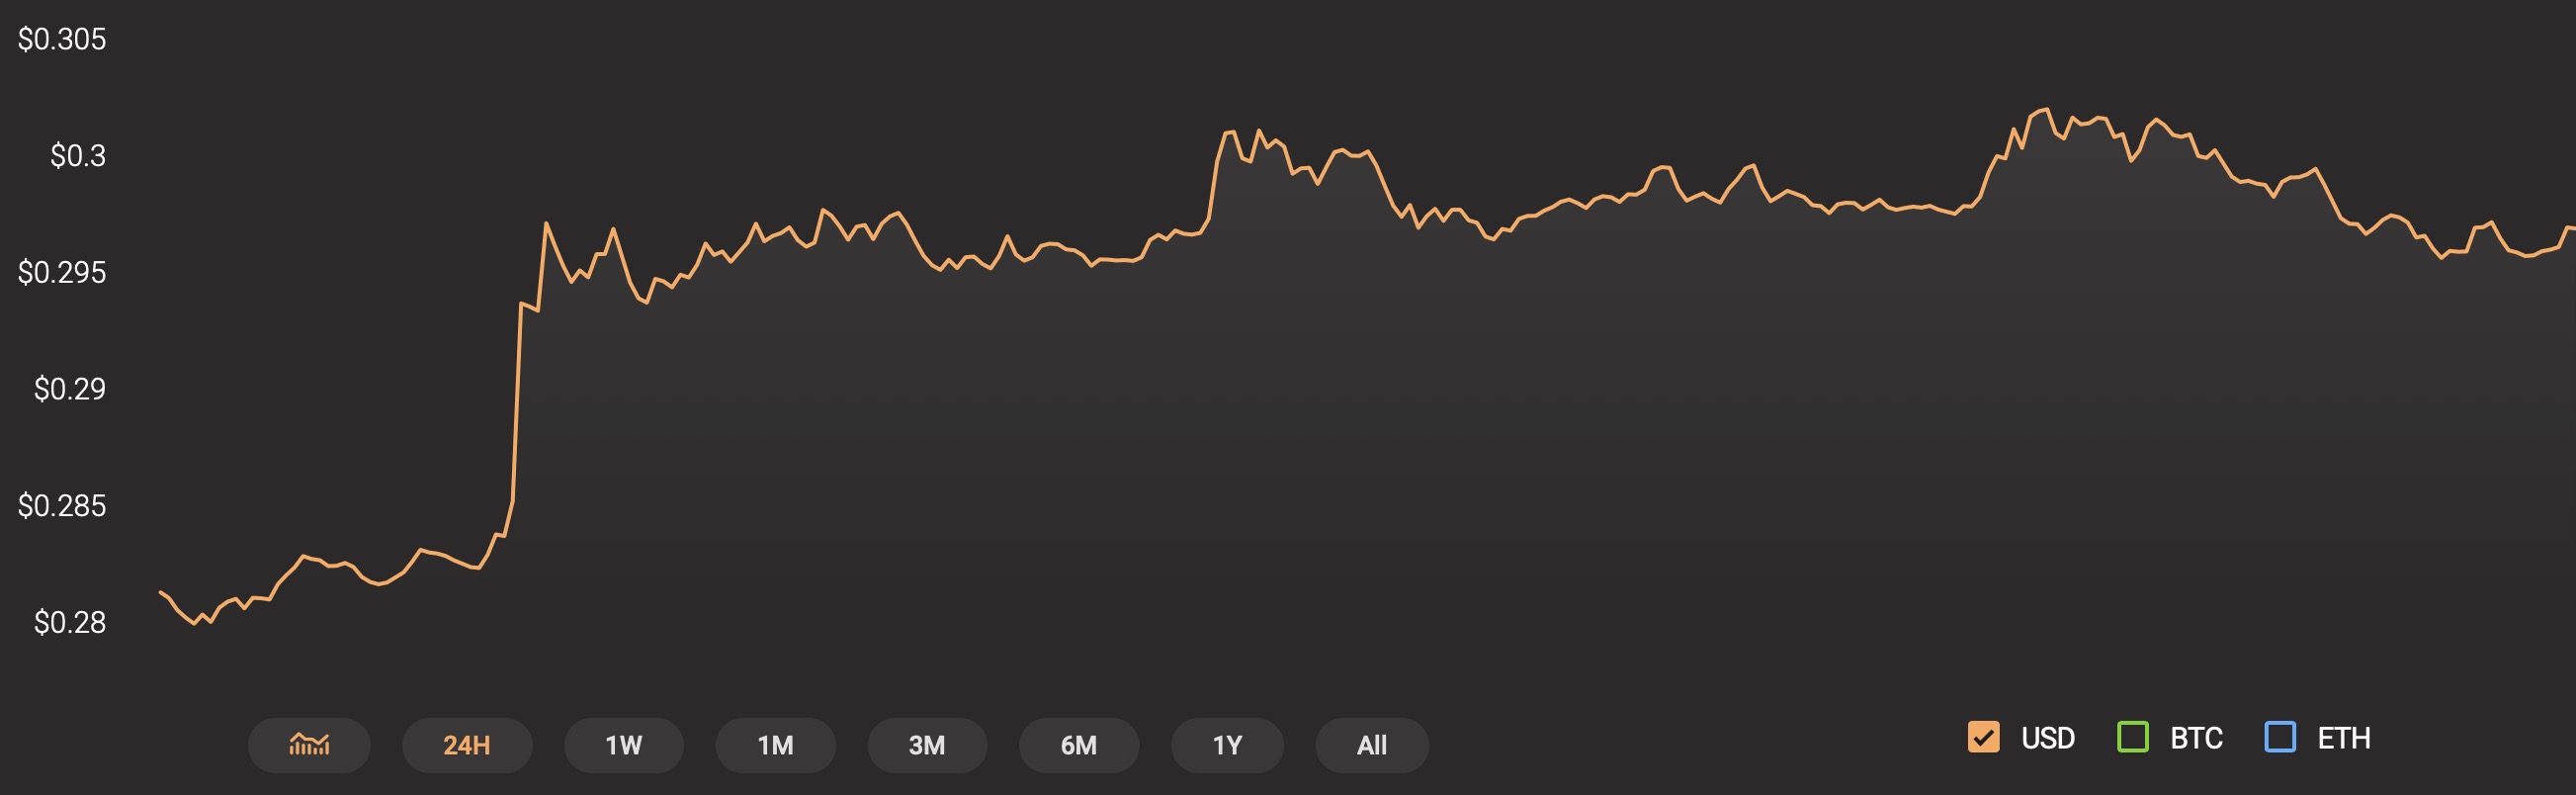
Source: CoinStats
1-hour chart
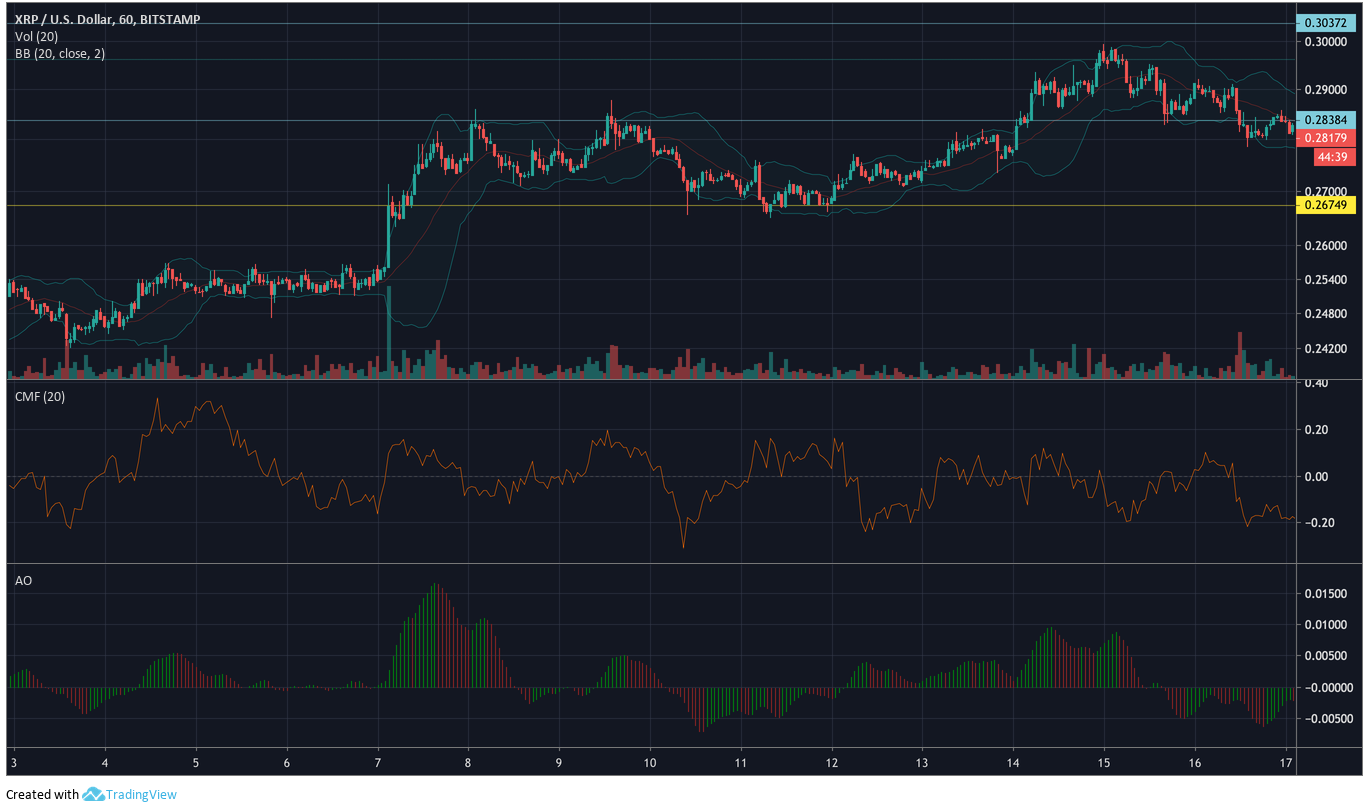
Source: XRPUSD on TradingView
Resistance 1: $0.273
Resistance 2: $0.304
Support 1: $0.268
Despite having breached below Resistance 1, XRP seems be doing well consolidating around the $0.28 mark
The converging of the Bollinger Bands show that price volatility is lower than before.
Chaikin Money Flow has been moving near the -0.20 mark, indicating more distribution than accumulation.
Awesome Oscillator exhibited the appearance of green with weak bearish momentum as the bars looked to be getting progressively smaller.
1-day chart
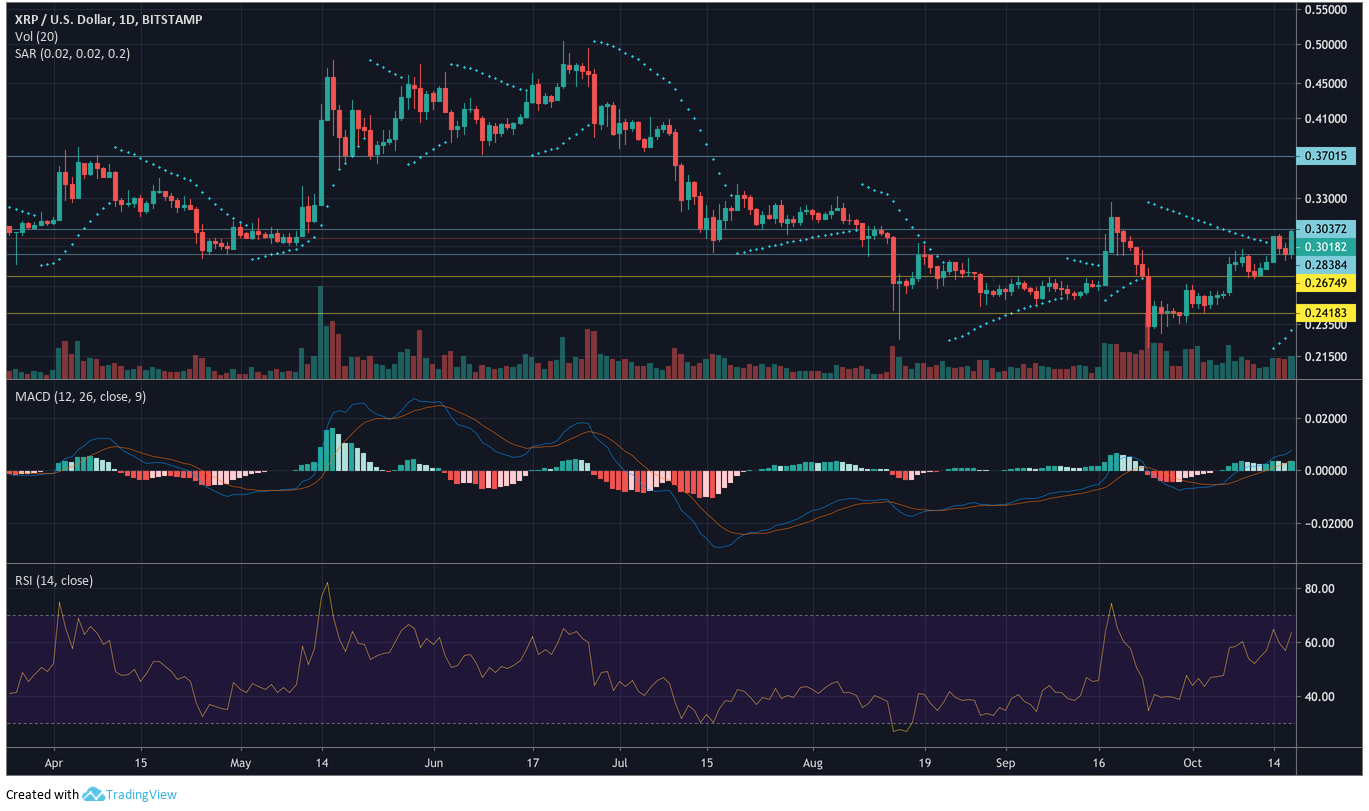
Source: XRPUSD on TradingView
Resistance 1: $0.284
Resistance 2: $0.304
Resistance 3: $0.370
Support 1: $0.268
Support 2: $0.242
The 1-day chart indicated that the price of XRP had been moving up through resistances, currently testing Resistance 2.
Relative Strength Index was moving just above the 60 mark, leaning towards being oversold.
Parabolic SAR suggests the XRP is in a bull market, as the dots appear under the price candles.
MACD indicated bullish momentum, with the signal line having crossed over the MACD line.
Conclusion
XRP should be stable in the short term, with low price volatility, while the long term chart indicates a bullish momentum.