XRP loses August swing low, but here’s why its price could bottom near $0.78
XRP may be approaching a long-term rising trendline support around $0.78.



XRP has been deeply affected by the crypto market’s sell-offs in recent weeks. Towards the end of September, when Bitcoin [BTC] was challenging the $87K resistance level, XRP bulls were trying to establish a foothold above the $1.50 supply zone.
They pushed the price as high as $1.65, but could not go any higher. The subsequent selling, fueled by fear and cascading liquidation waves, has driven XRP back below a swing low that is both technically and psychologically important.
XRP faces bearish price structure shift, while an analyst called a market bottom
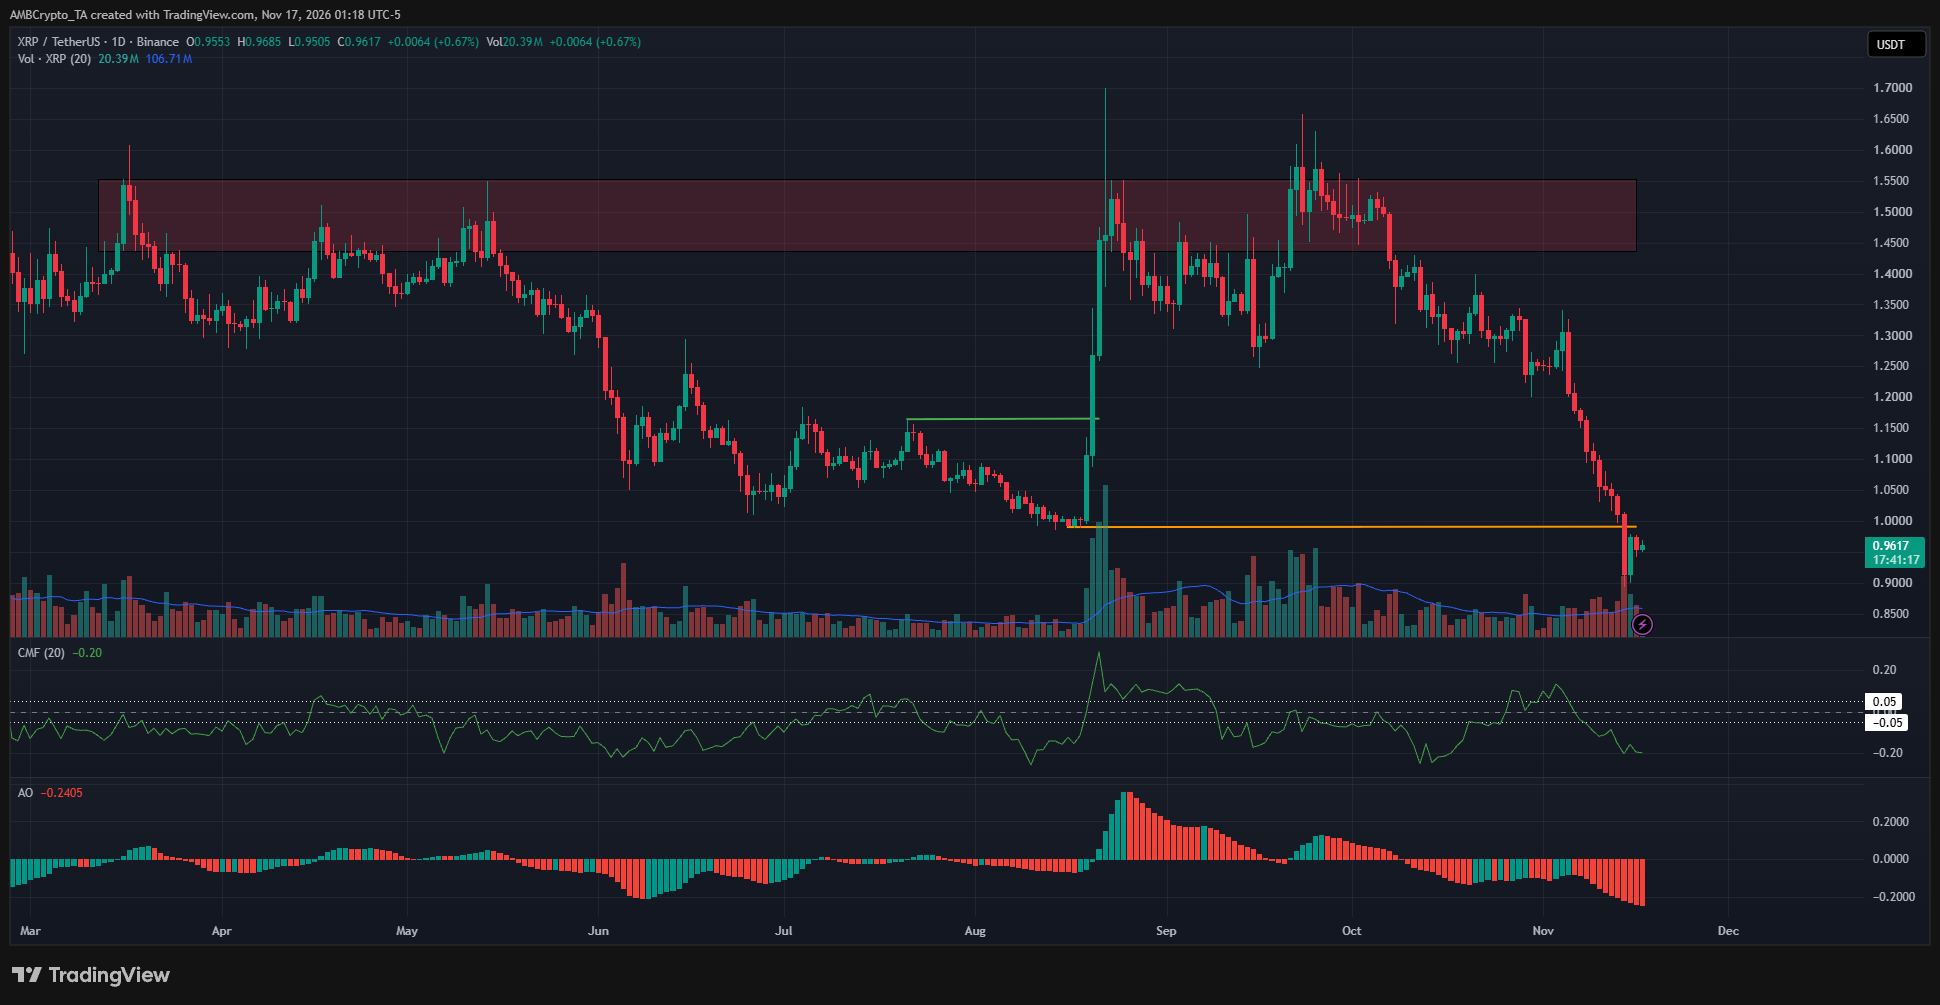
XRP’s bullish price structure shift in August (green) originated at the swing low at $0.99 (orange). The same low was breached during the selling in recent weeks.
The CMF slipped below -0.05 to signal heavy capital outflows earlier in November. The Awesome Oscillator was also well below the zero line, highlighting intense southbound momentum.
Against this bearish backdrop on the daily timeframe, crypto analyst and trader Ali Martinez posted an encouraging chart. The weekly timeframe has formed an ascending triangle pattern over the past five years.
The rising trendline of the triangle is about to be tested, and could be the long-term bottom. His prediction suggested that the current dip could extend to $0.78.
Here, it’s worth noting that the analyst’s call for a market bottom was accompanied by net buying on Coinbase. As well as a TD Sequential buy signal on the daily timeframe.
XRP price prediction — Look to sell the bounce!
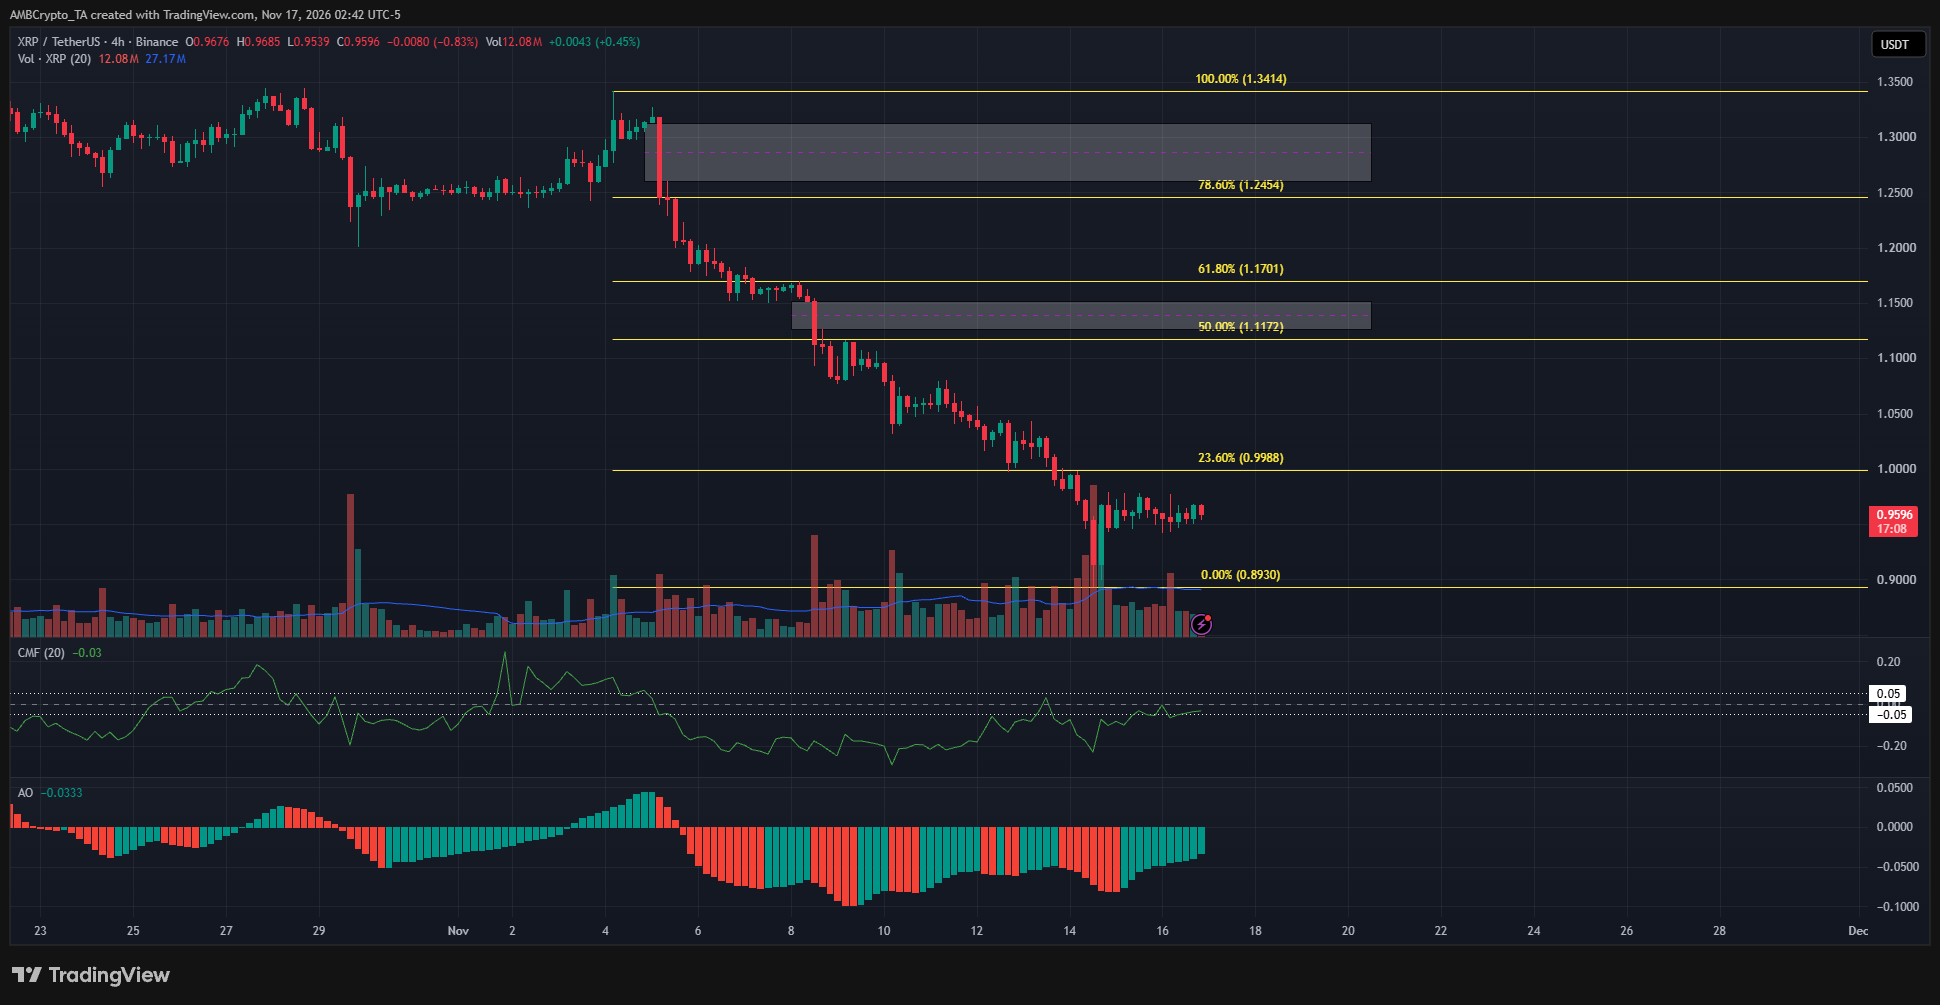
The 4-hour chart was also bearish alongside the daily timeframe. The drop to $0.893 saw a bounce to $0.95 in just few days. The CMF also moved into neutral territory, while the Awesome Oscillator’s green histogram bars suggested that bearish momentum was weak.
A price move above $1.0 would be an indication of a corrective bounce. Such a bounce is likely to reach $1.13 and $1.28, the notable imbalances overhead. This would also happen to align somewhat well with the Fibonacci retracement levels.
Final Summary
- XRP might be approaching a long-term rising trendline support around $0.78, which could mark a market bottom.
- Short-term bias for the altcoin has been bearish, and traders can look to sell a bounce towards $1.13-$1.28.