
XRP threatened to fall back towards the $1-mark in case of a breakdown from the $1.22-support. The Fibonacci Extension tool presented a few targets around $2 for MATIC. Finally, Dogecoin was unable to break above the $0.569-resistance and selling pressure returned to its market.
XRP
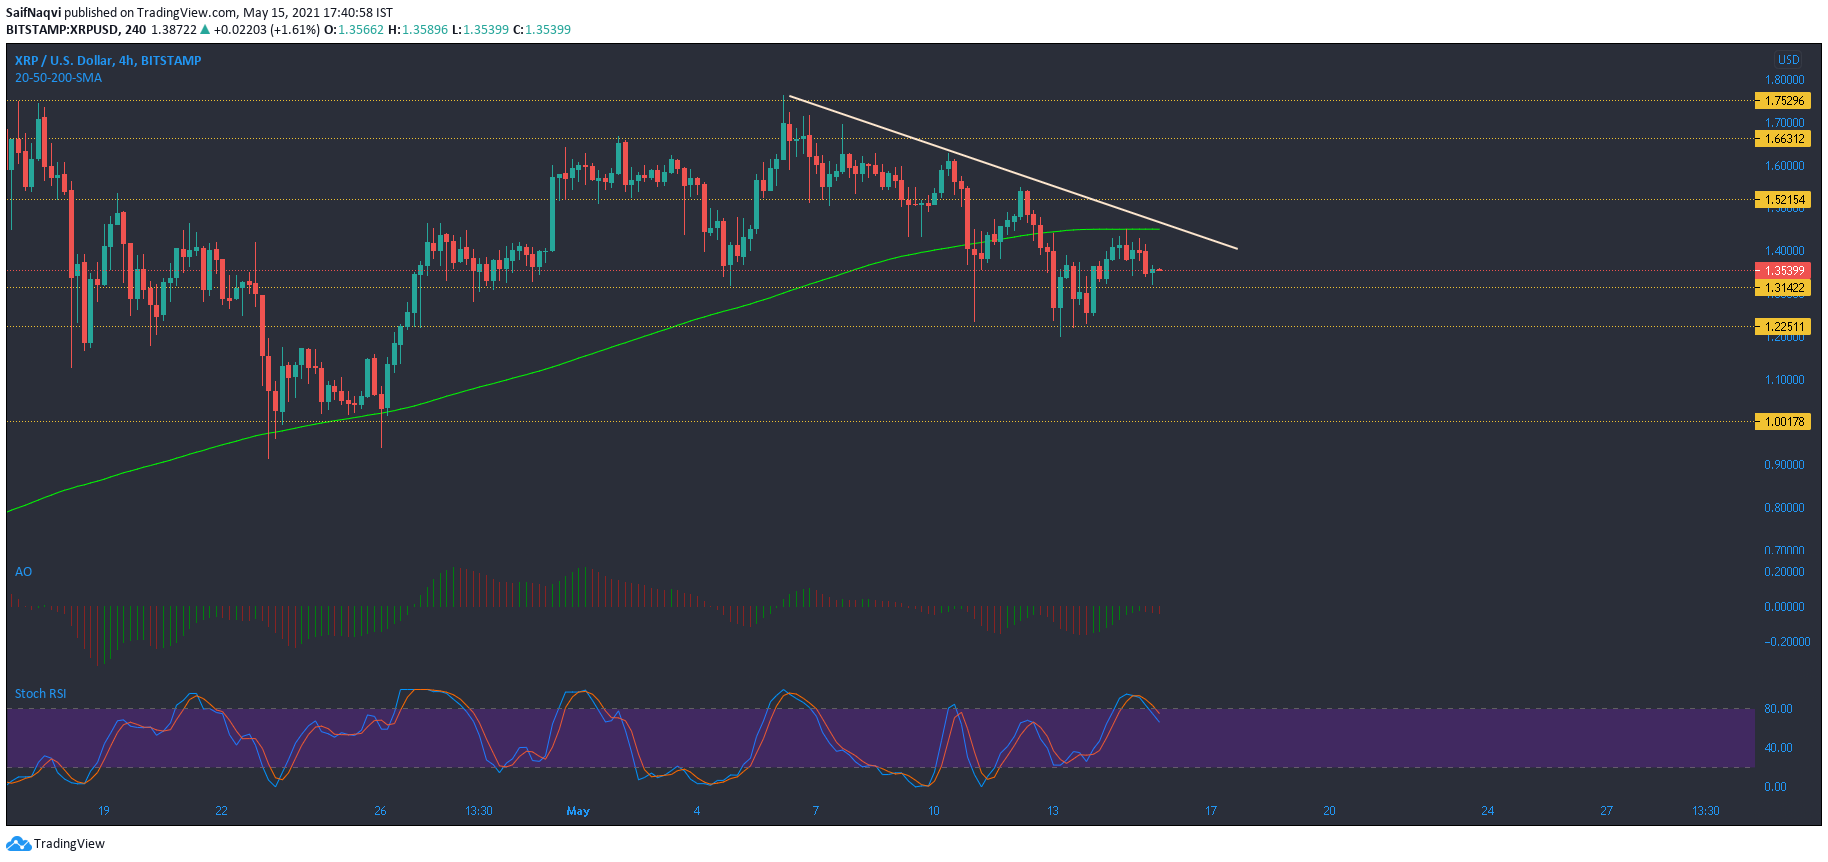
Source: XRP/USD, TradingView
Weekly losses amounted to 11% in the XRP market, at the time of writing. Successive red candlesticks on the 4-hour timeframe highlighted strong selling after XRP bulls were unable to topple the $1.75-resistance. The candlesticks were now below their long-term moving average (200-SMA) for the second time since late February.
The Awesome Oscillator remained below the half-line as momentum sides with the sellers. A break below the $1.22-support could see more losses towards the $1-mark. Stochastic RSI reversed direction from the overbought zone and moved south, at the time of writing. A fall towards the oversold region could see another breakdown for XRP.
MATIC

Source: MATIC/USD, TradingView
MATIC showed a strong bullish trajectory, with the alt rising by a tremendous 33% in the last 24 hours alone. The Fibonacci Extension tool was used to make some sense of this rise and presented possible target levels. The 272.2% and 261.8% extension levels lay at $1.90 and $2.09, respectively. The MACD line moved well above the Signal line – A sign of bullish strength.
On the other hand, the RSI formed a bearish divergence and pointed to some weakness in the prevailing price trend. The RSI’s overbought territory also underlined the need for stabilization. However, it was still unclear at what levels a pullback would take place. A fall in trading volumes would only accentuate the probability of a correction.
Dogecoin [DOGE]
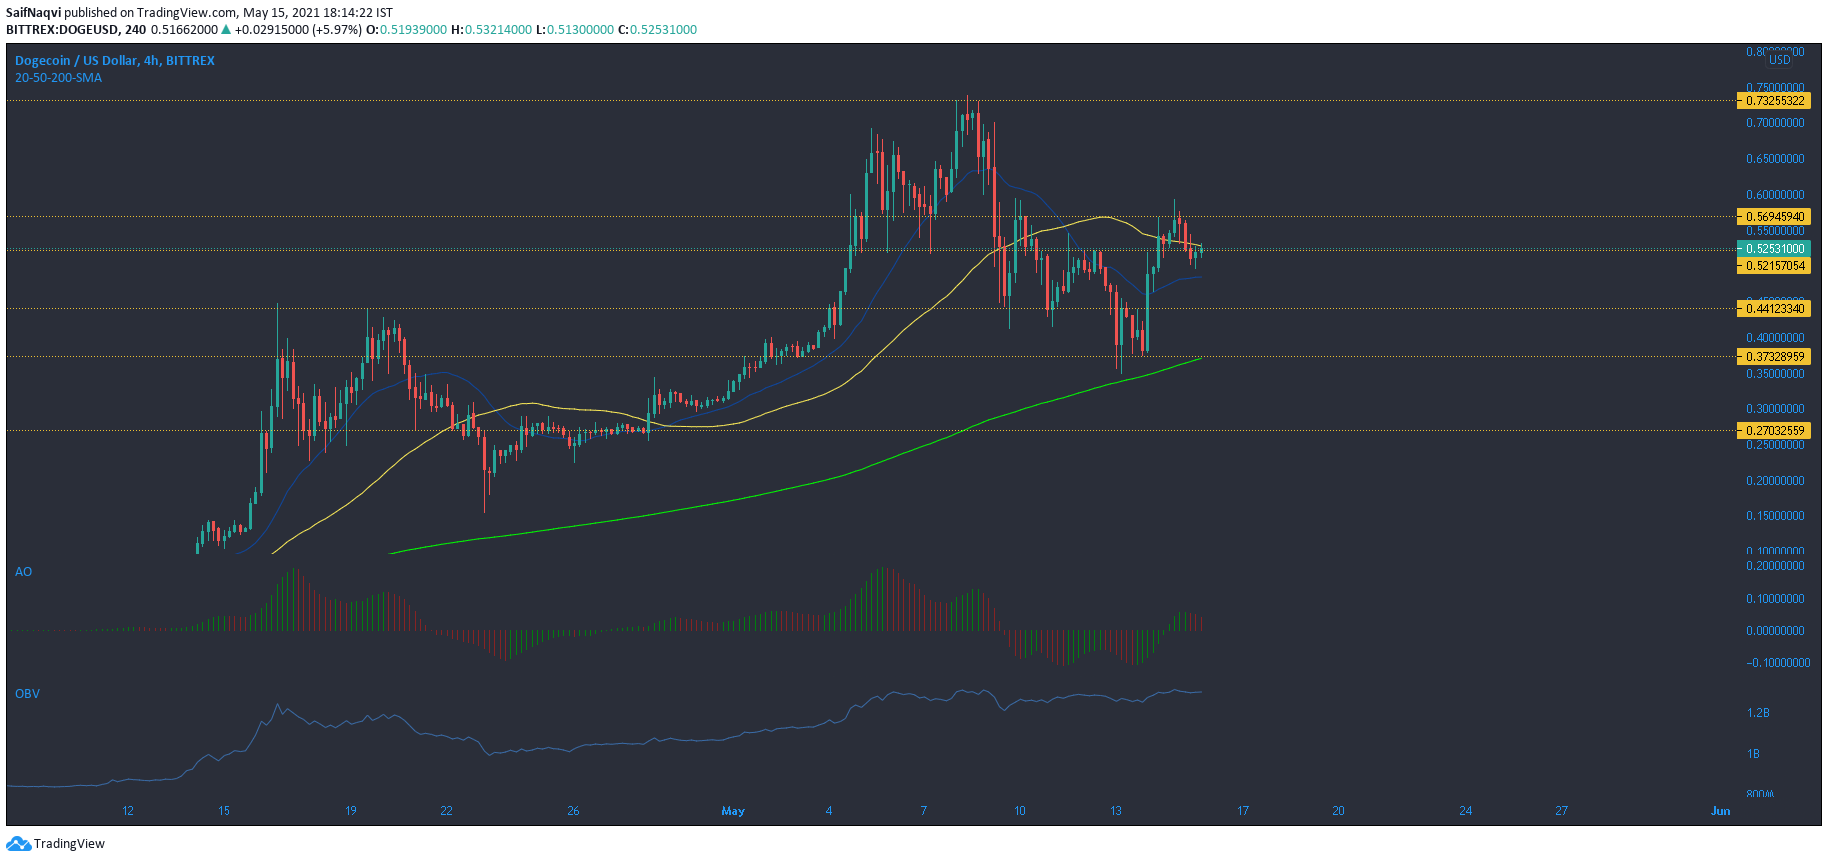
Source: DOGE/USD, TradingView
A previous analysis mentioned a buy signal above the $0.569-resistance, but this level was yet to be overturned. In fact, the 4-hour chart noted some selling pressure as Dogecoin moved towards its 20-SMA at $0.48. A break below the moving average could see DOGE go as low as $0.37 and the 200-SMA. On the plus side, this would offer a long opportunity.
The Awesome Oscillator registered consecutive red bars after DOGE was unable to reclaim the region above the $0.569-resistance. If the AO falls below the half-line, selling pressure would likely push DOGE towards $0.37. The OBV’s flat-like movement, at the time of writing, suggested that buying pressure outmatched selling pressure. This hinted at a period of consolidation.