XRP Price Analysis: 14 January

The end of 2020 was not pretty for XRP. After the SEC news spread like wild-fire, XRP’s value exhibited a free-fall in the charts. After registering a yearly high of $0.79 on November 24th, within a month on 29th December, XRP dropped to a mere $0.17. The present year has been more kind with XRP currently valued at just under $0.30. At press time, XRP was ranked 4th in the chart with a market cap of $13.3 billion.
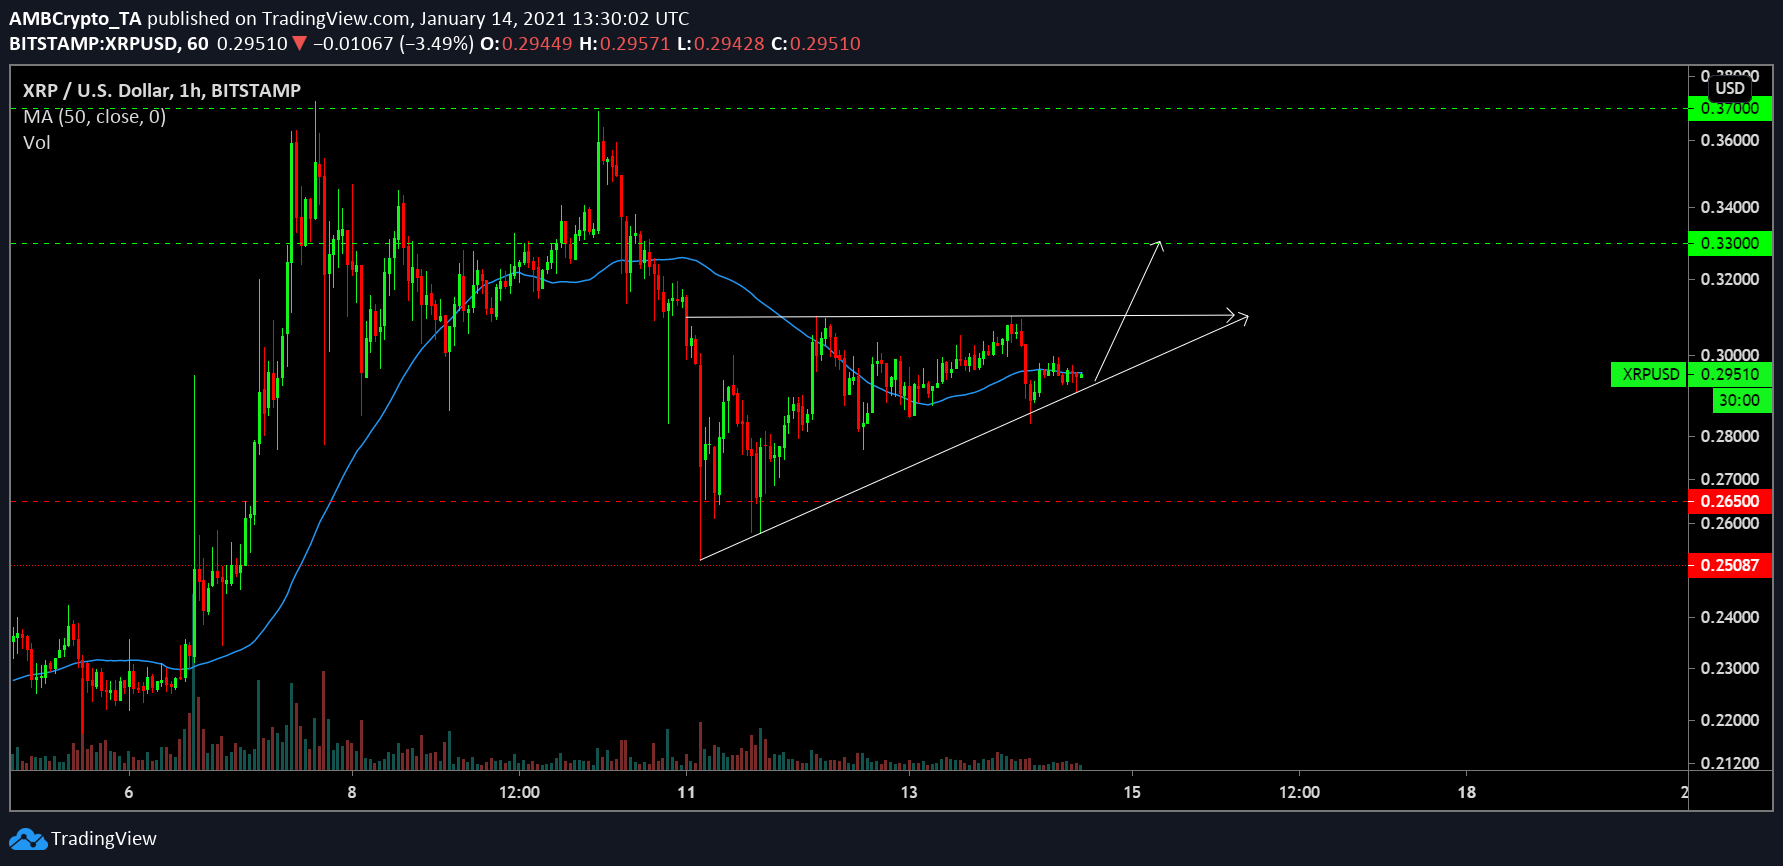
XRP hourly chart

Source: XRP/USD on Trading View
The short term chart for XRP suggested a bullish market structure for the asset. Picturing the formation of an ascending triangle at press time, the token has registered strong lower highs within the pattern. Currently valued at $0.295, the immediate resistance lies at $0.33, with the yearly high resistance at $0.37, right after.
One particular rejection is the current low trading volume, which suggested an overall weakness in the rally. The 50-moving average also remained just above the candle, as the asset may re-trace downwards from here on.
Market Rationale

Source: XRP/USD on Trading View
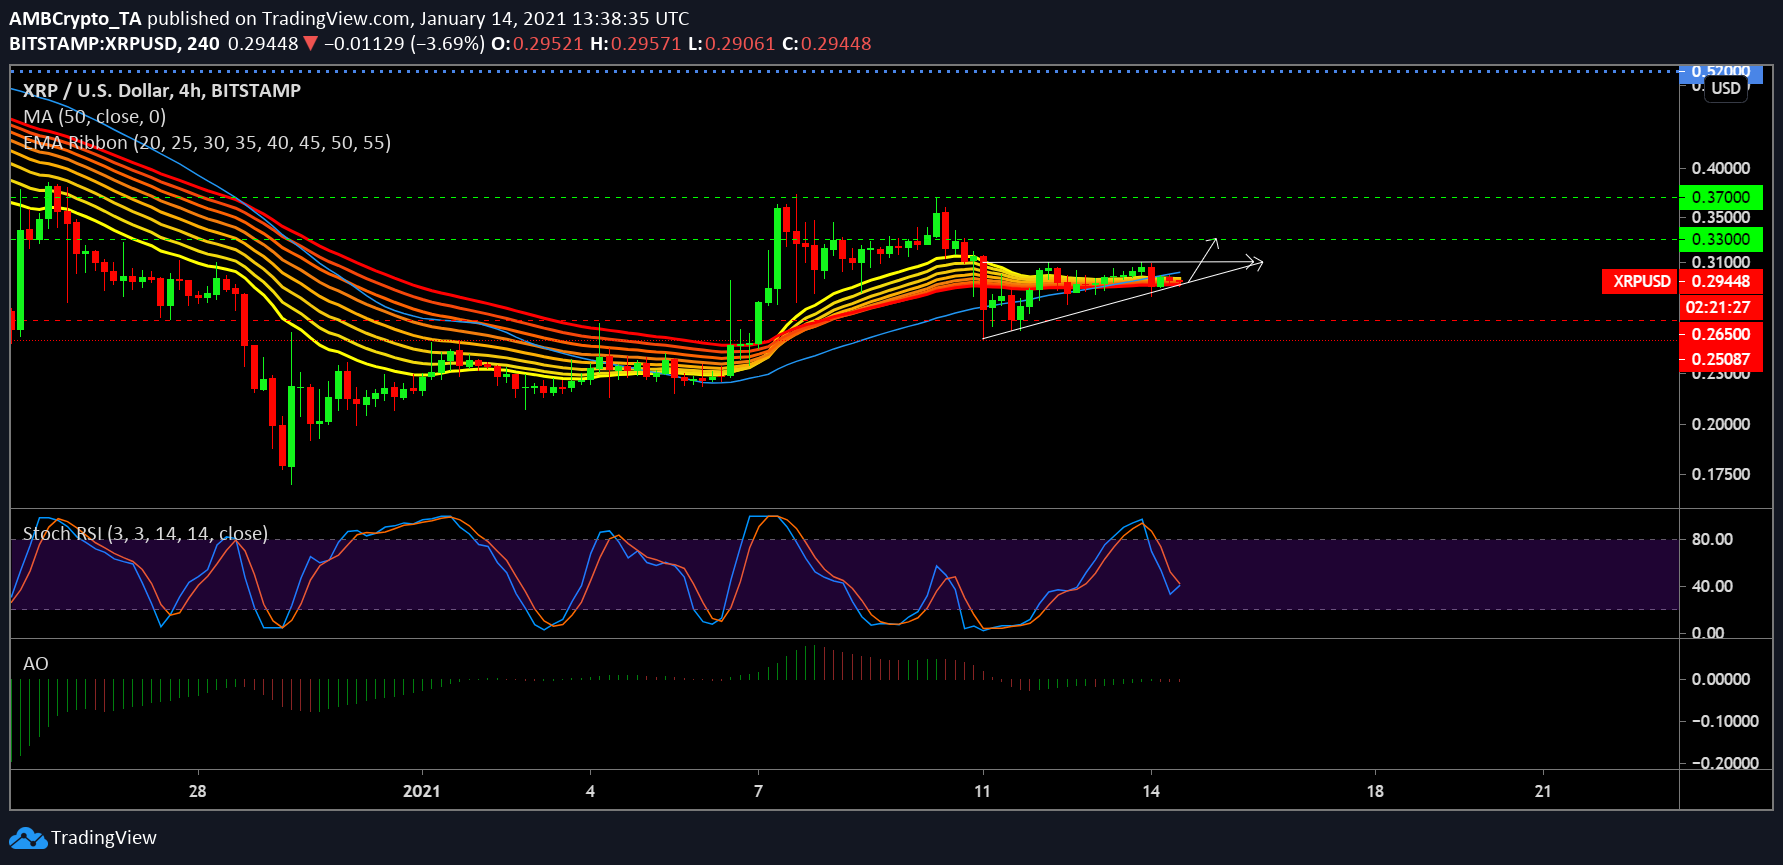
Market Indicators also inclined more towards a bearish scenario despite a bullish pattern. According to EMA ribbons, the bullish ribbons are currently contracting in the charts, suggestive of a trend reversal.
Stochastic RSI indicated a minor bullish shift but the crossover was not complete. It is likely to change in the next few hours depending on the price.
Lastly, Awesome Oscillator suggested vague bearish momentum but remained neutral over the day. It might side with the bears as the day progresses.
Conclusion
With respect to both pattern and market indicators, there is immense uncertainty at the moment. XRP may attain a re-test at $0.33 but an equal possibility remains towards a $0.265 plunge. It will be crucial to observe the next few hours, but for the time being, longs or shorts should be avoided.


