XRP Price Analysis: 19 March

Disclaimer: The findings of the following analysis are the sole opinions of the writer and should not be taken as investment advice
XRP has had an eventful few months. While the regulatory woes surrounding XRP did cause the price to crash towards the end of 2020, the altcoin was surging by the end of January 2021. However, its bullish momentum stagnated over the past few weeks, with XRP continuing to maintain prolonged sideways price movement.
At the time of writing, XRP was being traded at $0.470 with a market cap of over $21.5 billion. It registered a slight dip of over 0.5 percent in the last 24 hours, with the next few trading sessions likely to see more price corrections.
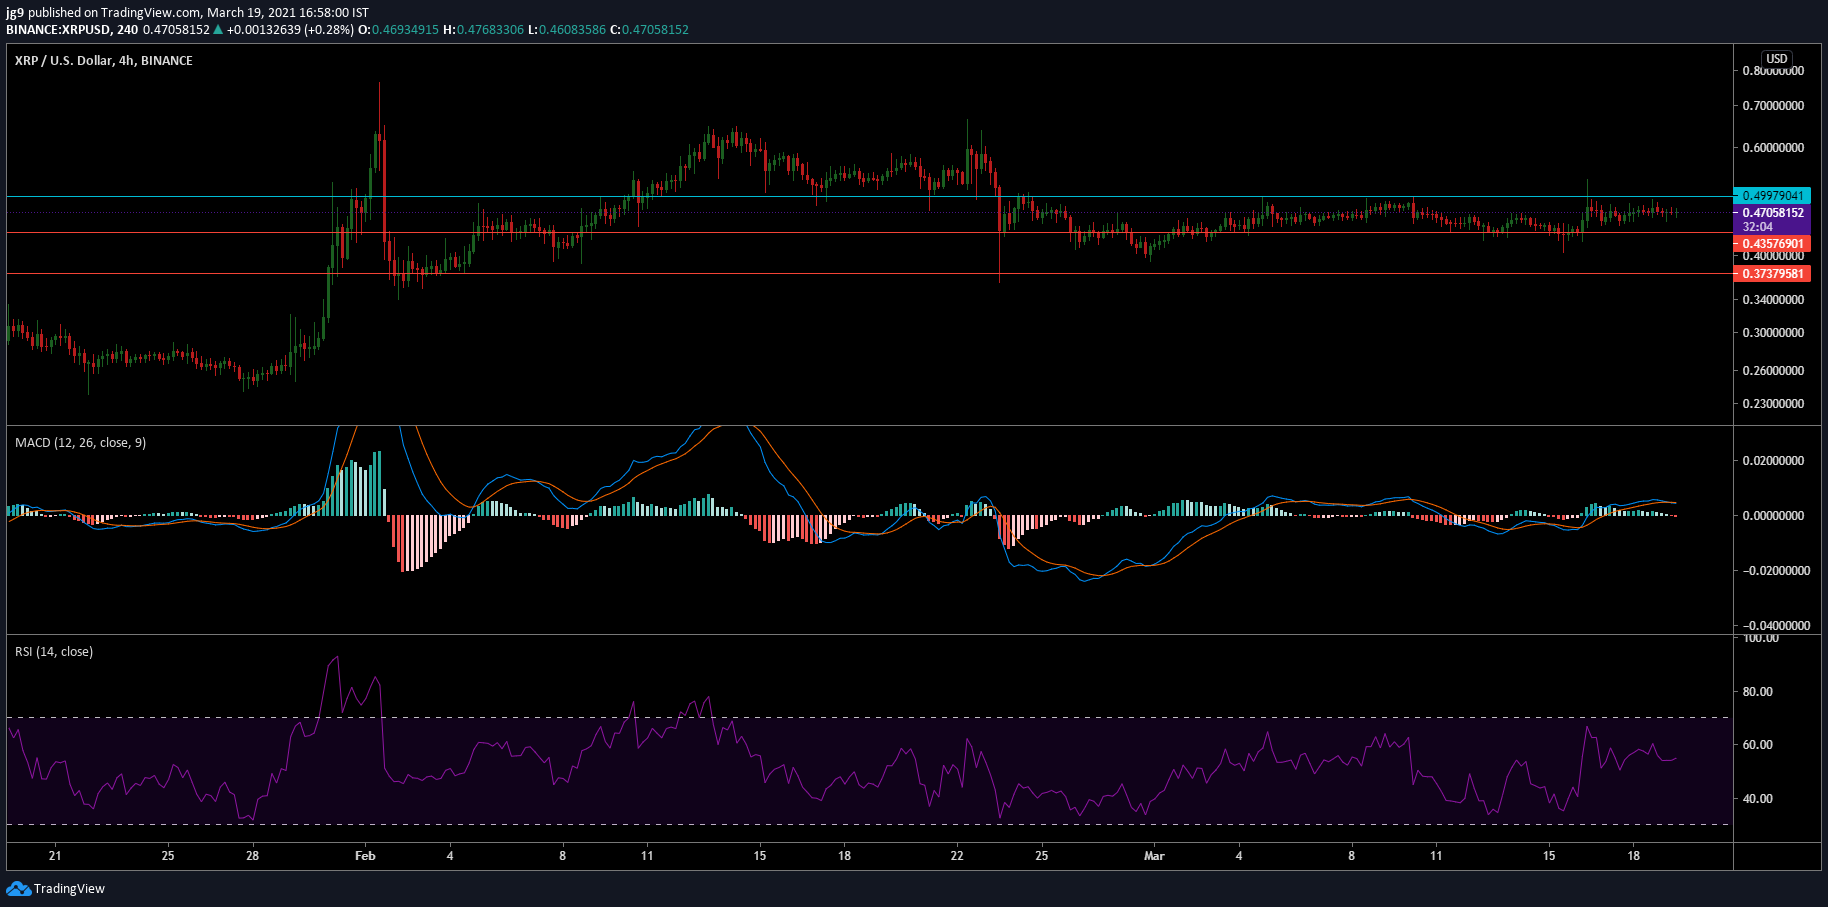
XRP 4-hour chart

Source: XRP/USD, TradingView
XRP’s price has been rangebound for a while, with the same continuing to trade between its immediate resistance of $0.499 and its closest support around the $0.435-price range. XRP has attempted to breach the aforementioned resistance level for quite some time now, but there didn’t seem to be enough momentum for the altcoin in the near-term.
Given the fact that the coin has been in a period of consolidation, it is hard to determine whether a short or long trade would work best in the short-term.
In the coming day’s time, if the bears take control then XRP may head towards the $0.43-price range. However, a dip below the said level seemed unlikely, at the time of writing.
Rationale
XRP’s technical indicators highlighted the trend reversal that was taking place. The MACD indicator was on the verge of a bearish crossover as the Signal line was inching closer to a position above the MACD line. The RSI indicator noted a bit of divergence as it was closer to the neutral zone, but continued in the direction of the overbought zone.
Conclusion
For XRP in the short-term, two possible scenarios may unfold. The coin may see a trend reversal, one leading to a slight dip in price. In such a case, a valuation around the current support level can be expected. On the other hand, the coin can also continue its present path and see the price trade sideways in the next 24-48 hours.


