


Within a period of 6-days, XRP surged by 51%, and over the past 24-hours, lost most of the gains attained during Bitcoin’s rally to its ATH. The price movement has been extremely volatile and the past day has been particularly detrimental due to several external factors. We analyzed XRP’s current short-term chart to identify if a pullback upwards or further corrections are on the menu.
XRP 1-hour chart

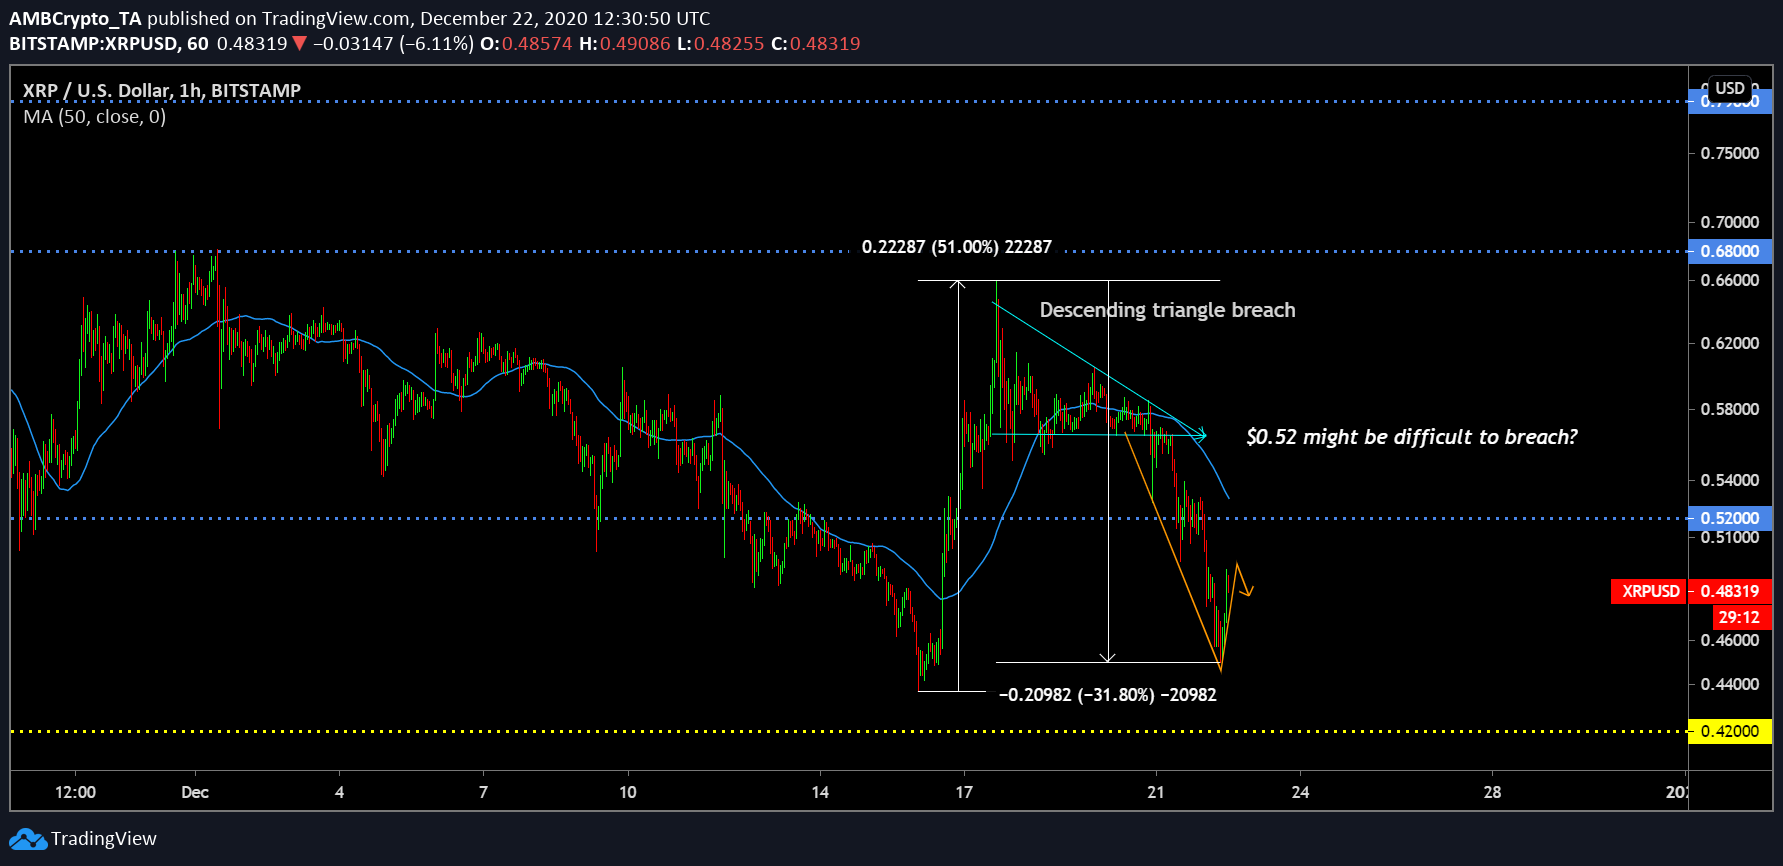
From $0.43 to $0.659, XRP registered a flash hike over the past week which was met with strong corrections. The asset oscillated inside a descending triangle pattern, which further deteriorated any chances of a quick recovery. However, after the breakout from the pattern, the last 24-hours have been extremely poor for XRP. While the token dropped under the support of $0.52, the asset may have lost a bit of traction due to the recent SEC news.
According to recent reports, the SEC is planning to sue Ripple for selling “unregistered securities”, in short, XRP.
While that might have had a negative impact on the crypto’s value, it did register a minor hike over the past few hours. The asset remained above key support at $0.42 but any movement under that range can be disastrous.
Market Rationale

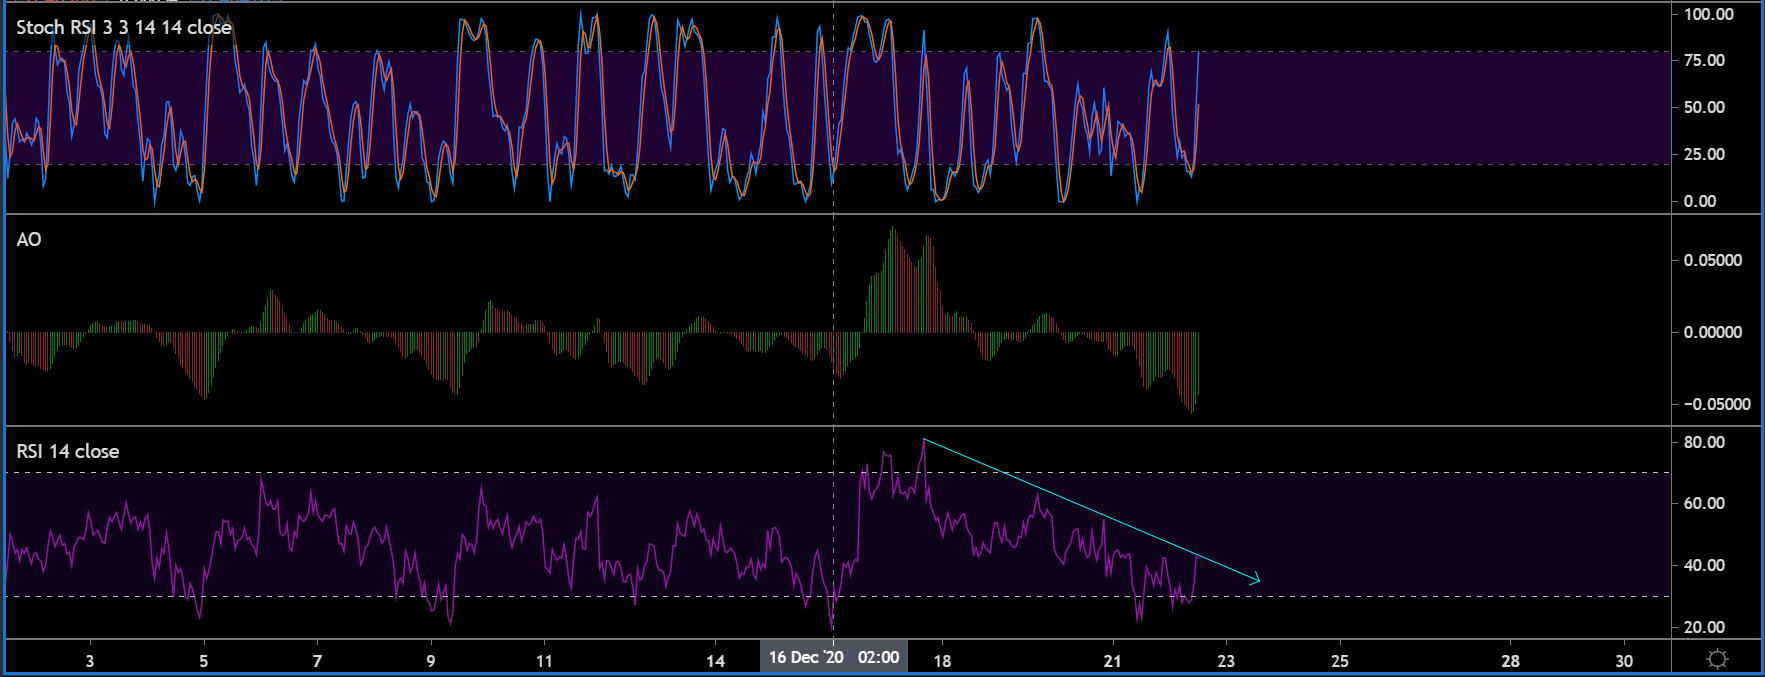
While Stochastic RSI indicated a bullish period, it might soon undergo another reversal, with the bullish line nearing an overbought region at press time. Awesome Oscillator or AO also indicated a revival of bullish momentum but remains underwhelming at the moment.
The Relative Strength Index or RSI, showed buying pressure which suggested a recovery, but it may falter from here on as suggested by the eventual decline over the last week.
Conclusion
Volatility is extremely high for XRP at the moment. With negative press surrounding Ripple and XRP, there can be further corrections if XRP hodlers begin to sell their holdings.