
FLOKI crypto sees 32% daily gain – Traders, should you buy now?
News

XRP price triggers a 70% bearish breakout; this is what traders can do
Posted:
| Last updated: January 30th, 2024

XRP’s price has set in motion a bearish outlook that could push it back to levels last seen in December 2020 and during the COVID crash of 2020. Therefore, investors need to exercise caution around Ripple.
XRP price fails to reap the benefits
XRP price action since 29 March has created four distinctive lower highs and higher lows, which when connected using trend lines show the formation of a symmetrical triangle, a pennant. This setup basically converges between two trend lines, squeezing the price. After a certain point, the coiling up breaks out into a volatile move.
Unlike other setups that have a bias, a pennant could break either way. This technical formation forecasts a 69% move, determined by adding the distance between the first swing high and low to the breakout point.
Although XRP price resolved in a bullish move after the last three retests of the lower trend line, the latest tag, however, resulted in a bearish move. As the crypto markets crashed on 5 May, XRP price followed suit, breaching the pennant’s lower trend line at $0.575.
Adding the forecasted measure to this breakout point shows a target of $0.176. However, unlike a lot of altcoins, the XRP price has maintained its momentum and not flash crashed. So there is hope for bulls if there is a quick recovery above the lower trend line.
However, a failure could crash the remittance token to $0.330. A breakdown of this barrier will send the XRP’s price to its forecasted target of $0.176.
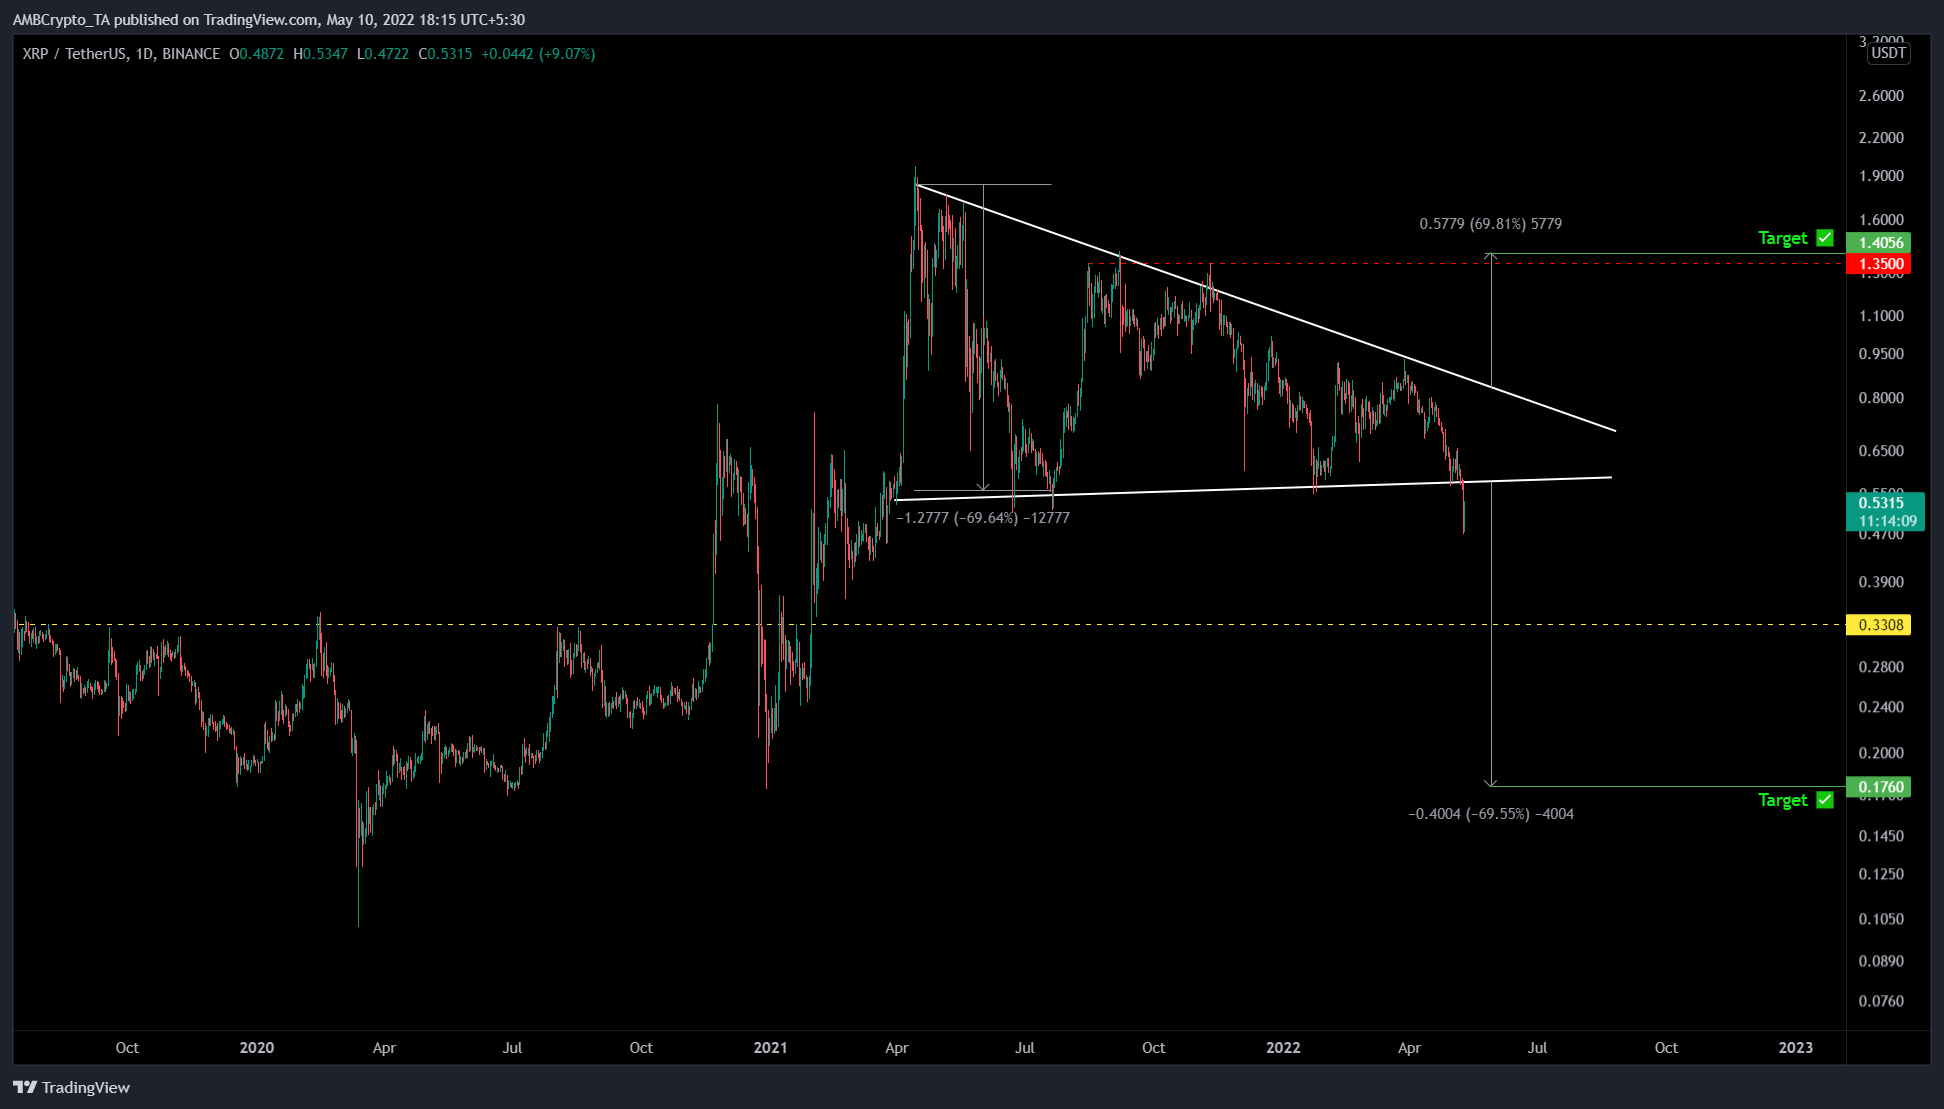
Source: TradingView, XRP/USDT 3-day chart
Supporting this potential move to the downside for XRP price is the 365-day Market Value to Realized Value (MVRV) model. As explained in previous articles, this indicator is used to gauge the sentiment of holders by measuring the average profit/loss of investors who purchased XRP tokens over the past year.
Generally, a negative value indicates that these holders are underwater and hence a sell-off is unlikely. However, a positive value indicates that holders are in profit, which apparently increases the chances of a crash.
Based on the historical data for XRP, the 365-day MVRV is hovering around -38% which is a well-known support level and has served as a base for reversal moves. However, there is a second support floor at -50%, which has triggered a trend change in December 2018, March 2020, and December 2020.
Therefore, the chances of dropping lower are still on the cards for XRP price, which interestingly, supports the bearish outlook described from a technical standpoint.
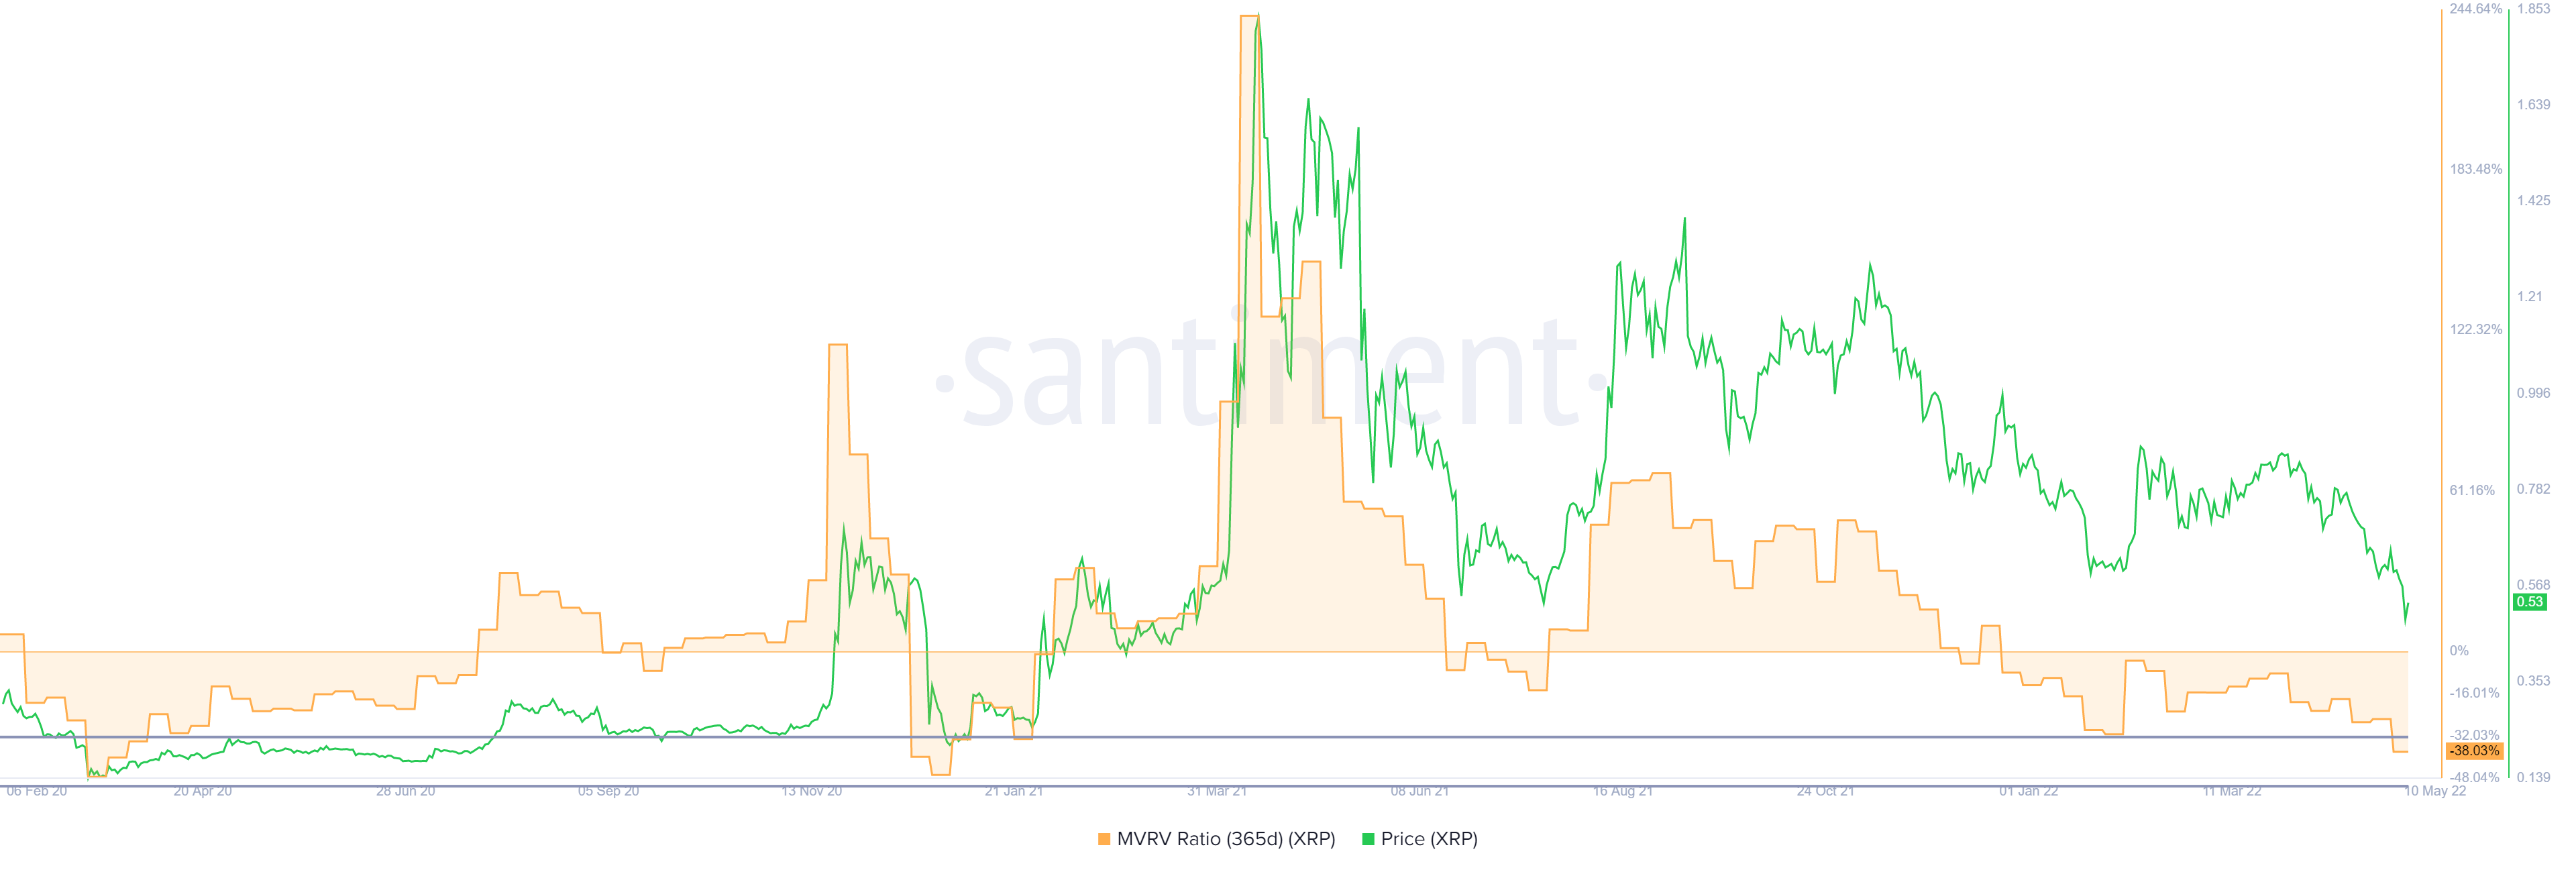
Source: Santiment


