XRP prices dip 10% in 7 days and the reasons are…
XRP’s network activity dropped substantially last month, along with its price.
- XRP’s daily active addresses fell as did its transaction count.
- The token’s price action remained bearish, but a few metrics hinted at a trend reversal.
XRP has witnessed a considerable drop in its network activity of late, reflecting a lack of users’ interest. Along with its key network metrics, the token’s price action also followed a similar declining trend.
Therefore, AMBCrypto took a closer look at XRP to find out if a trend reversal is possible anytime soon.
XRP’s network activity is dropping!
The last 30 days were not the best for XRP in terms of network activity, as several key metrics registered declined. Beginning with daily active addresses.
The metric, after spiking on 30th December, started to decline steadily, and at press time, the trend seemed to continue.
The blockchain’s transaction count and transaction volume also moved southwards during the same period, which looked concerning as it suggested less activity on the network.

XRP’s price has a similar fate
The same remained true for XRP’s price action, as it registered a double-digit drop last month. In fact, in the last seven days alone, the token’s value sank by nearly 10%.
At the time of writing, XRP was trading at $0.5139 with a market capitalization of over $27.9 billion.
It was interesting to see that while the token’s price crashed, whales took that opportunity to buy the token.
AMBCrypto reported earlier how XRP’s whale transaction count spiked a few days ago. Does that mean whales’ confidence will have a positive impact on XRP’s price?
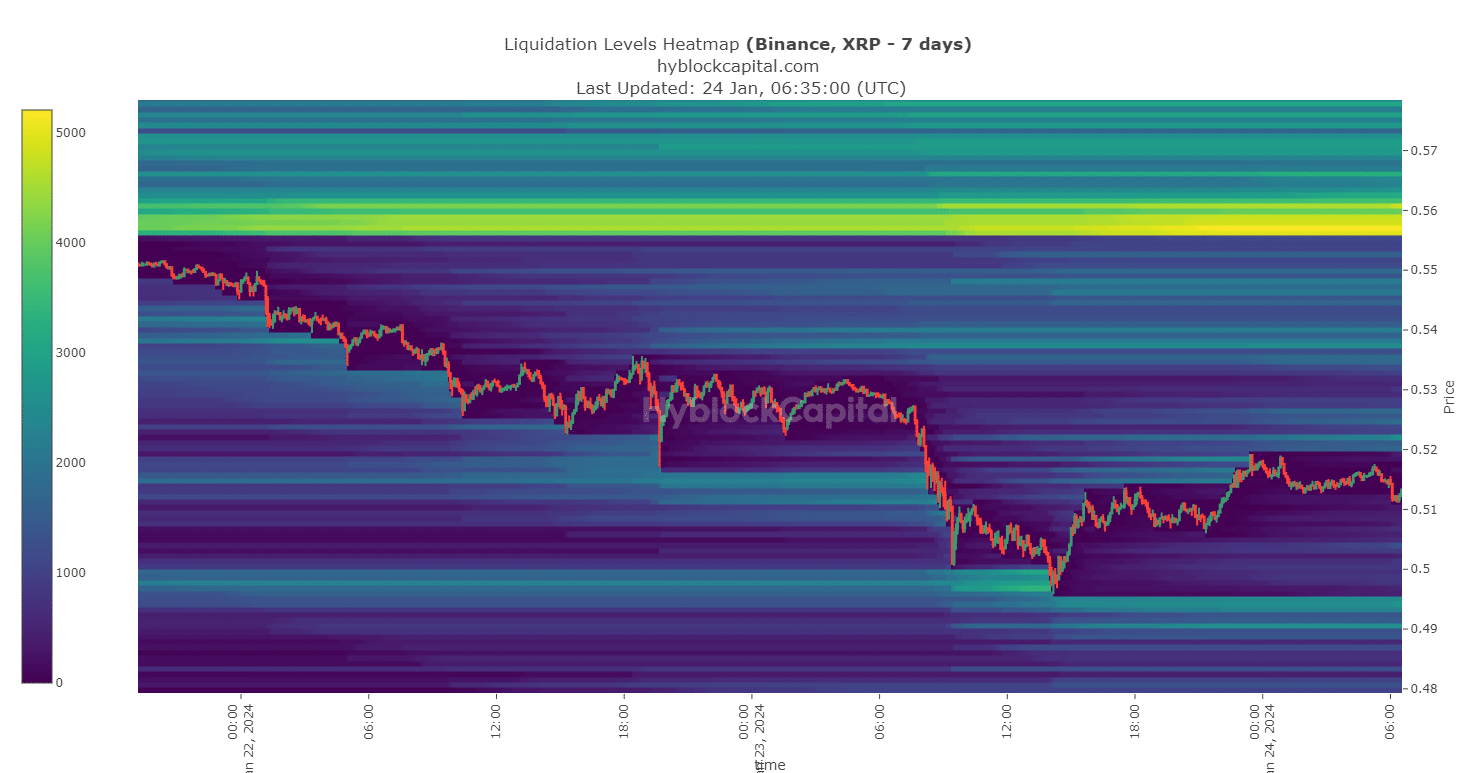
Our analysis of Hyblock Capital’s data revealed that XRP had a support level near the $0.49 mark, suggesting that its price could fall to that level before starting a northward rally.
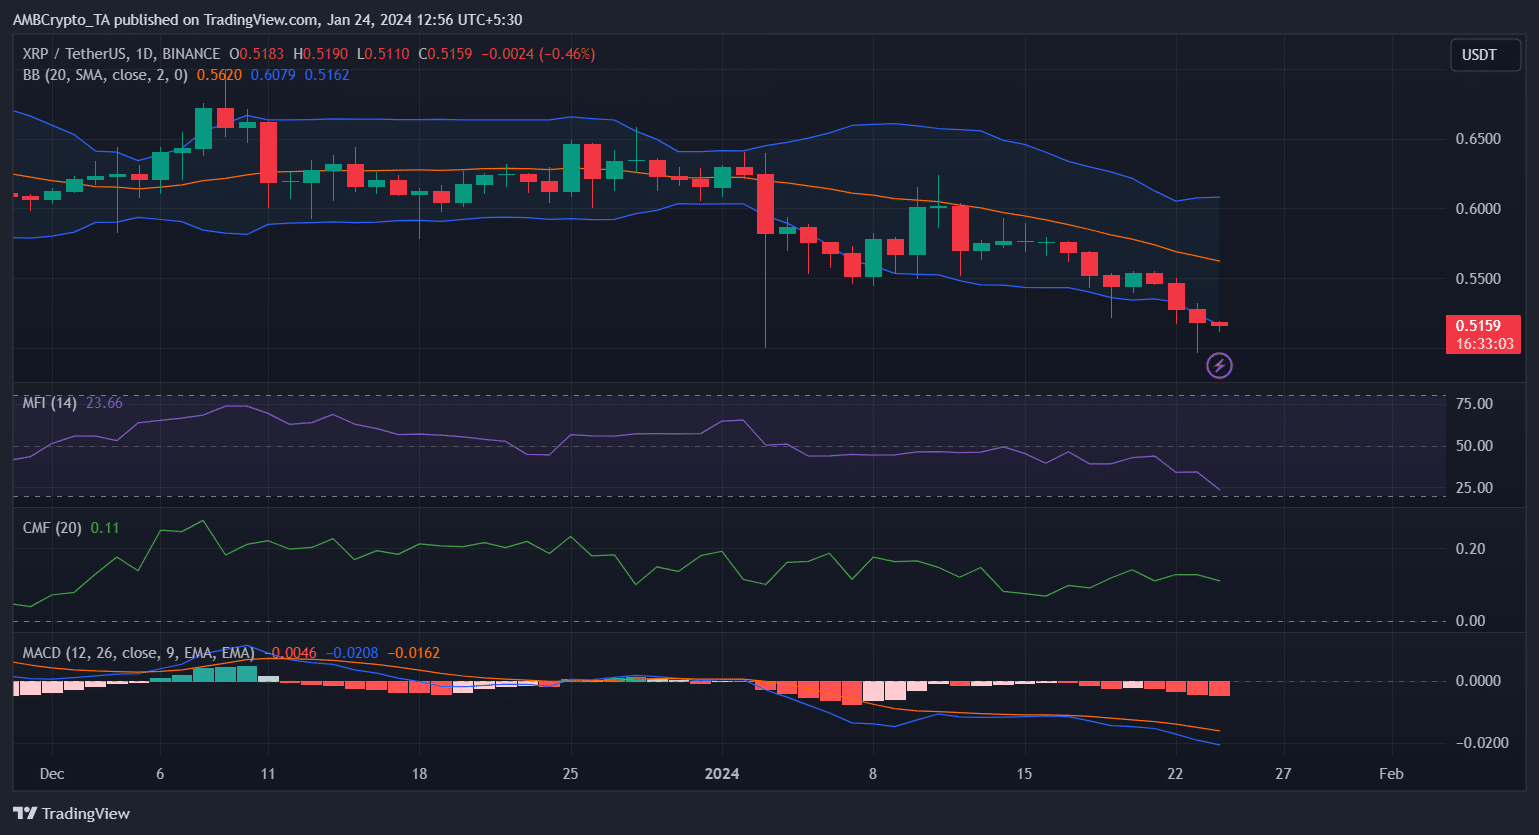
In fact, a few of the market indicators also hinted at the same possibility. For example, the token’s Chaikin Money Flow (CMF) registered a slight downtick.
Its MACD also displayed a clear bearish advantage in the market, indicating a continued price drop.
Nonetheless, a few other metrics told a different story. The token’s Money Flow Index (MFI) was about to enter the oversold zone, which can increase buying pressure.
Additionally, XRP’s price touched the lower limit of the Bollinger bands, suggesting a possible price rebound before the token’s price falls to $0.049.
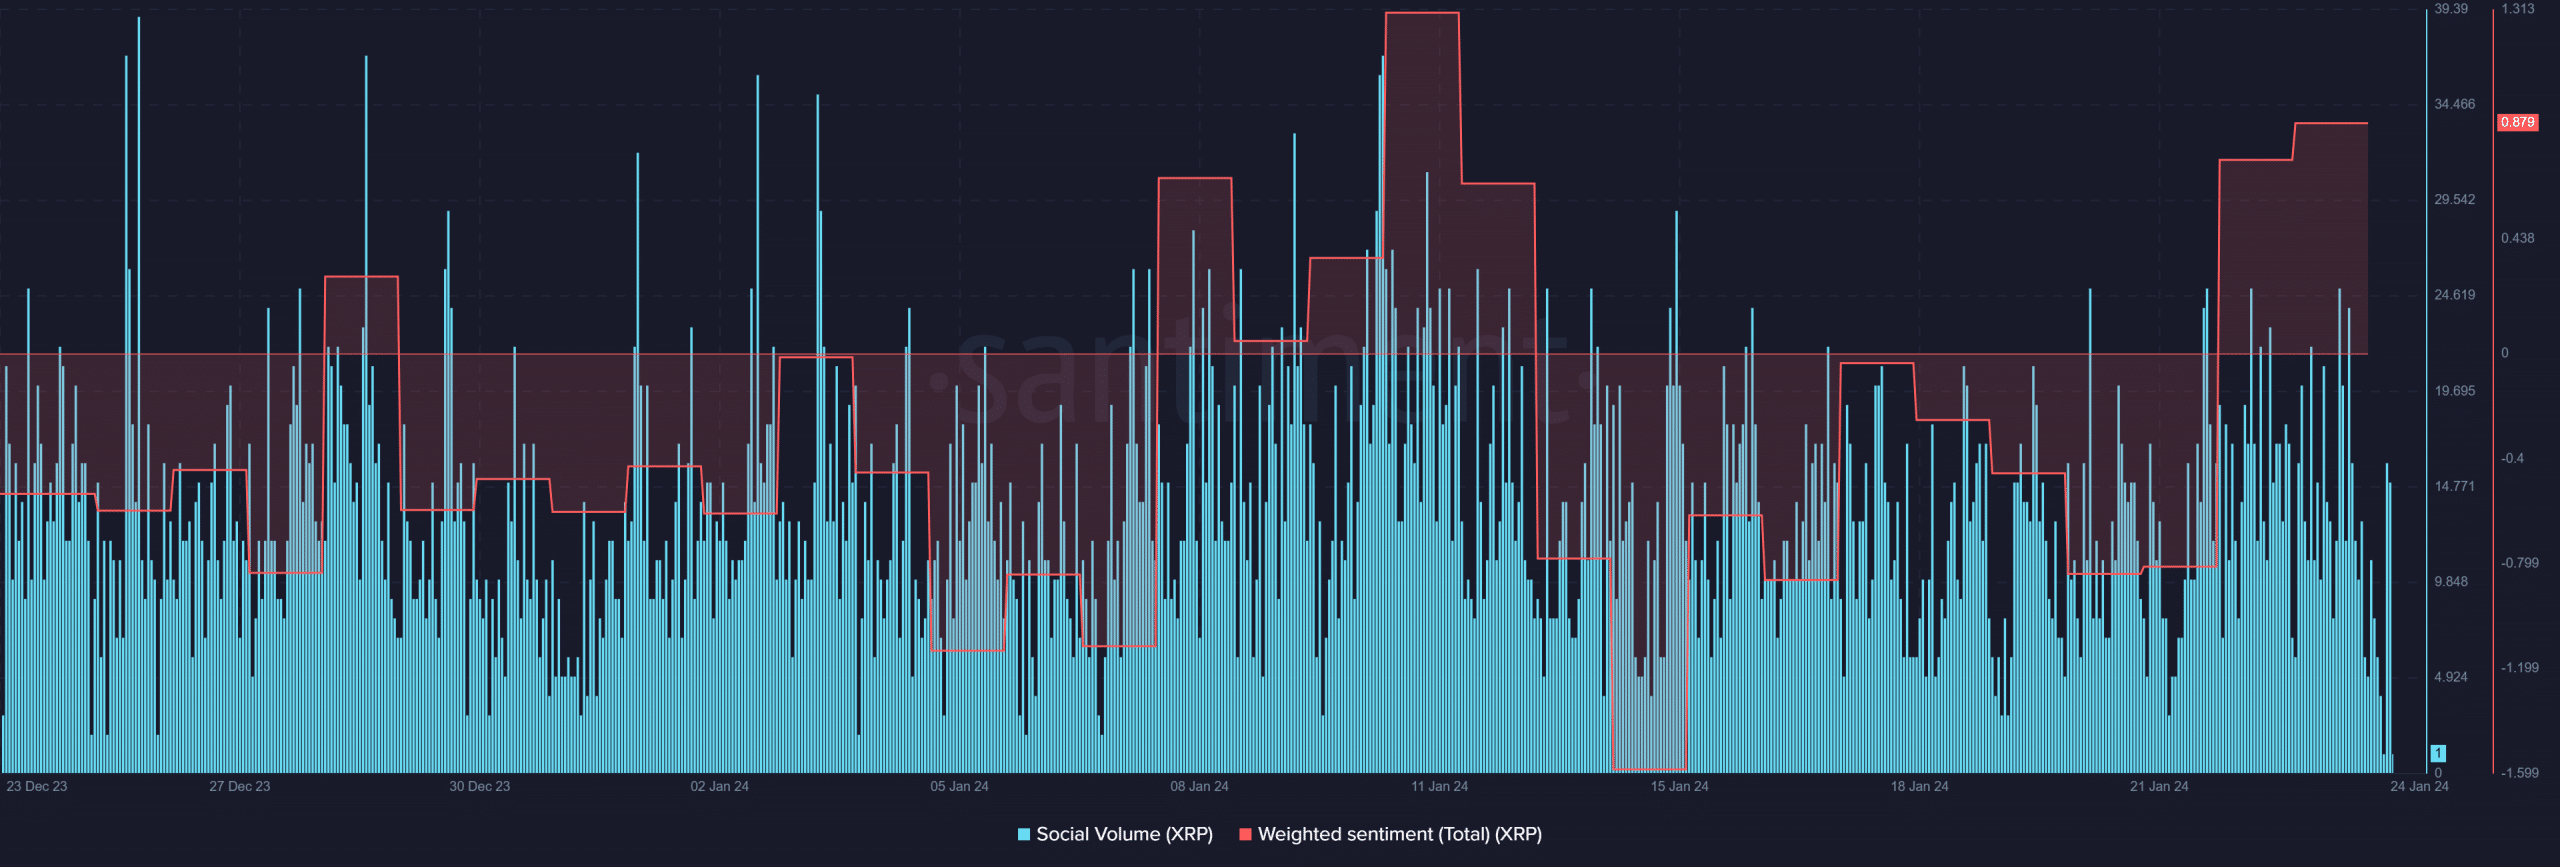
It was also surprising to note that, despite the bearish pierce action, sentiment around XRP turned positive.
Is your portfolio green? Check the XRP Profit Calculator
A look at Santiment’s data pointed out that XRP’s weighted sentiment moved upward, meaning that bullish sentiment around the token became dominant.
Its social volume also remained high last week, reflecting its popularity in the crypto space. Whether XRP manages to initiate a bull rally before reaching its support zone will be an episode to keep an eye on.