XRP reaches range highs, can further gains be expected

Disclaimer: The findings of the following analysis are the sole opinions of the writer and should not be considered investment advice.
XRP has performed incredibly well over the past few days. It has gained nearly 30% over the past week alone, due to the rally from $0.32 to $0.42.
For a coin ranked 7th on CoinMarketCap with a market capitalization of $20.16 billion, it was a remarkable surge. Looking forward, can the bulls keep the momentum going, or would the range-bound price action likely continue?
XRP- 3-Day Chart
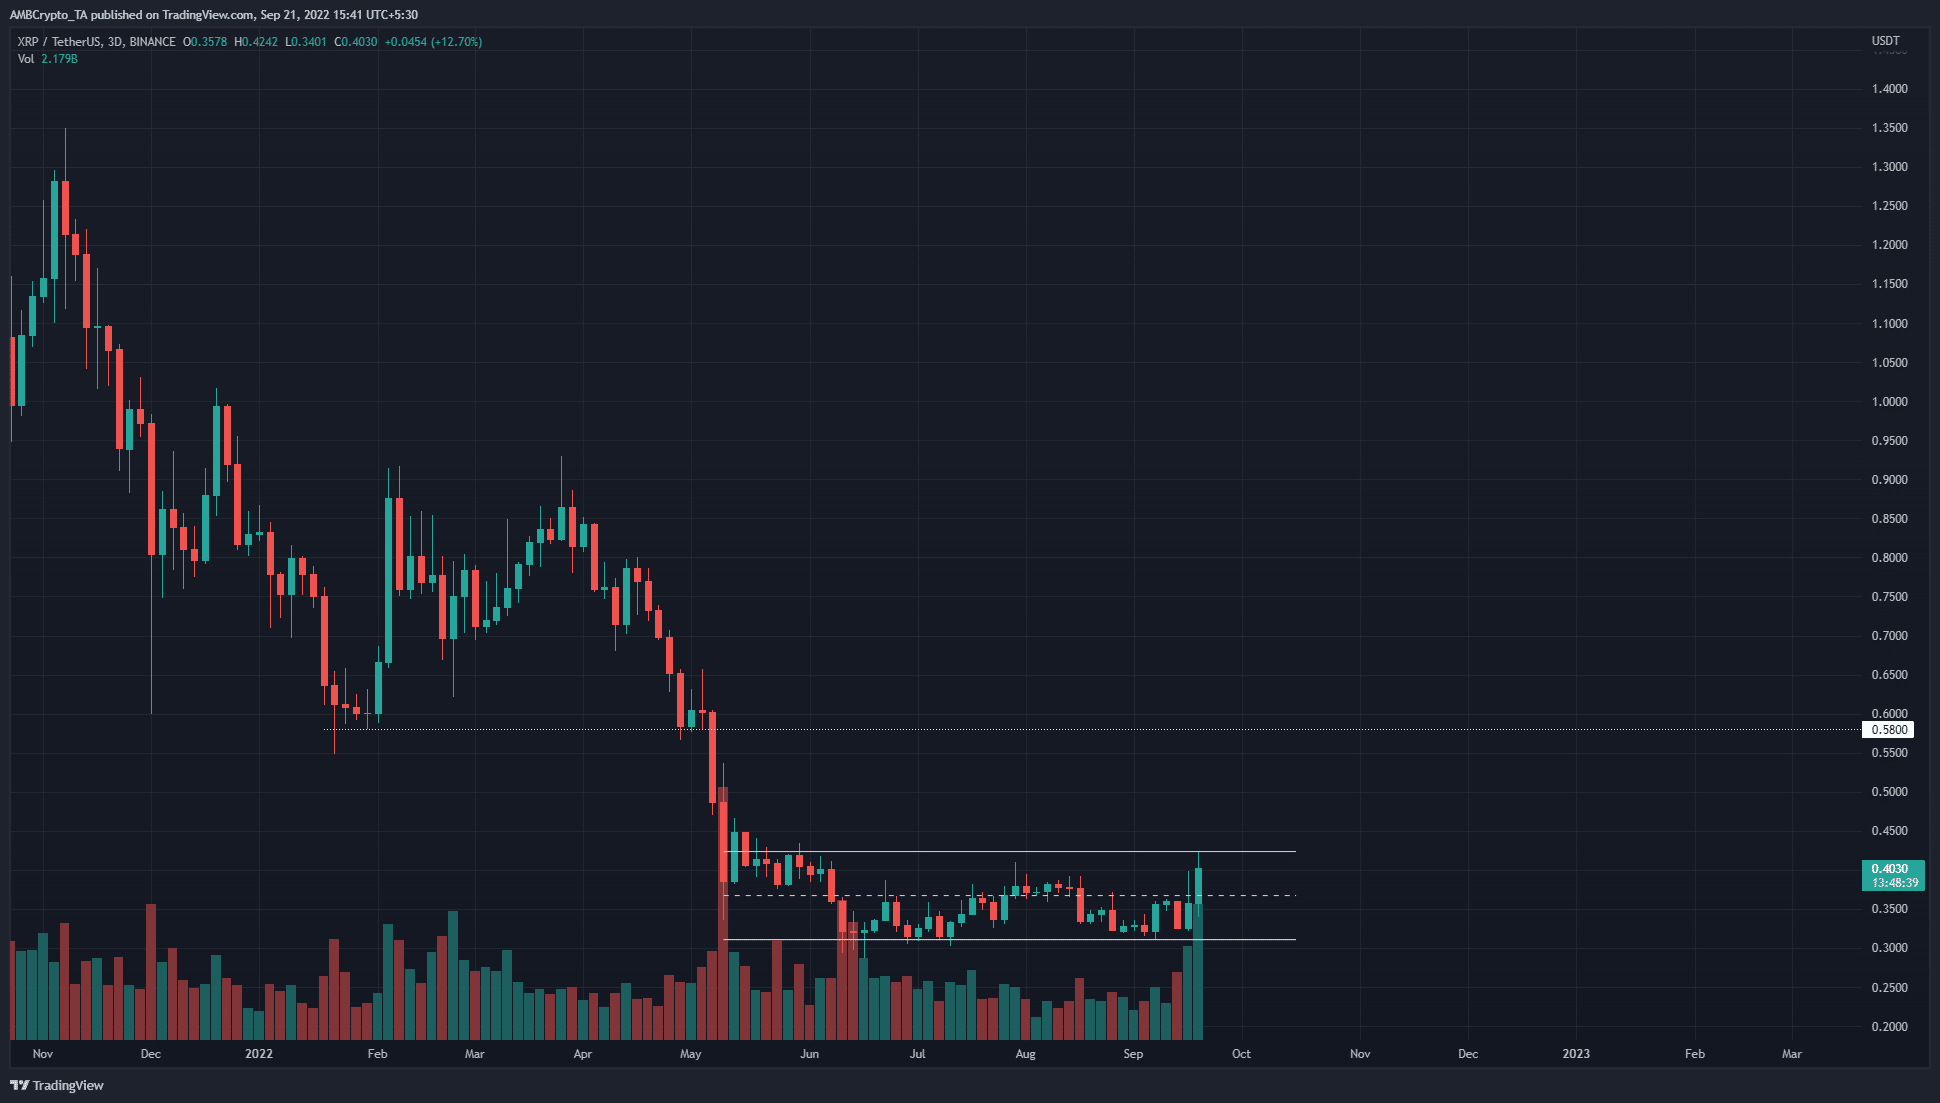
The 3-day timeframe showed the market structure to have taken a bullish turn. The price has formed a range (yellow) between $0.42 and $0.31.
In August, XRP climbed just above the mid-range value but couldn’t close a 3-day candle above $0.38. At the time of writing the most recent and ongoing candle looked like it could close above the August highs.
If this were to happen, the D3 structure would flip to bullish. Patience could see bulls rewarded, especially if XRP can succeed in flipping the range highs to support.
Yet, until that happens, trading within the range might be a safer mindset for a trader. In general, a continuation of a range happens more regularly than a strong breakout.
Rationale
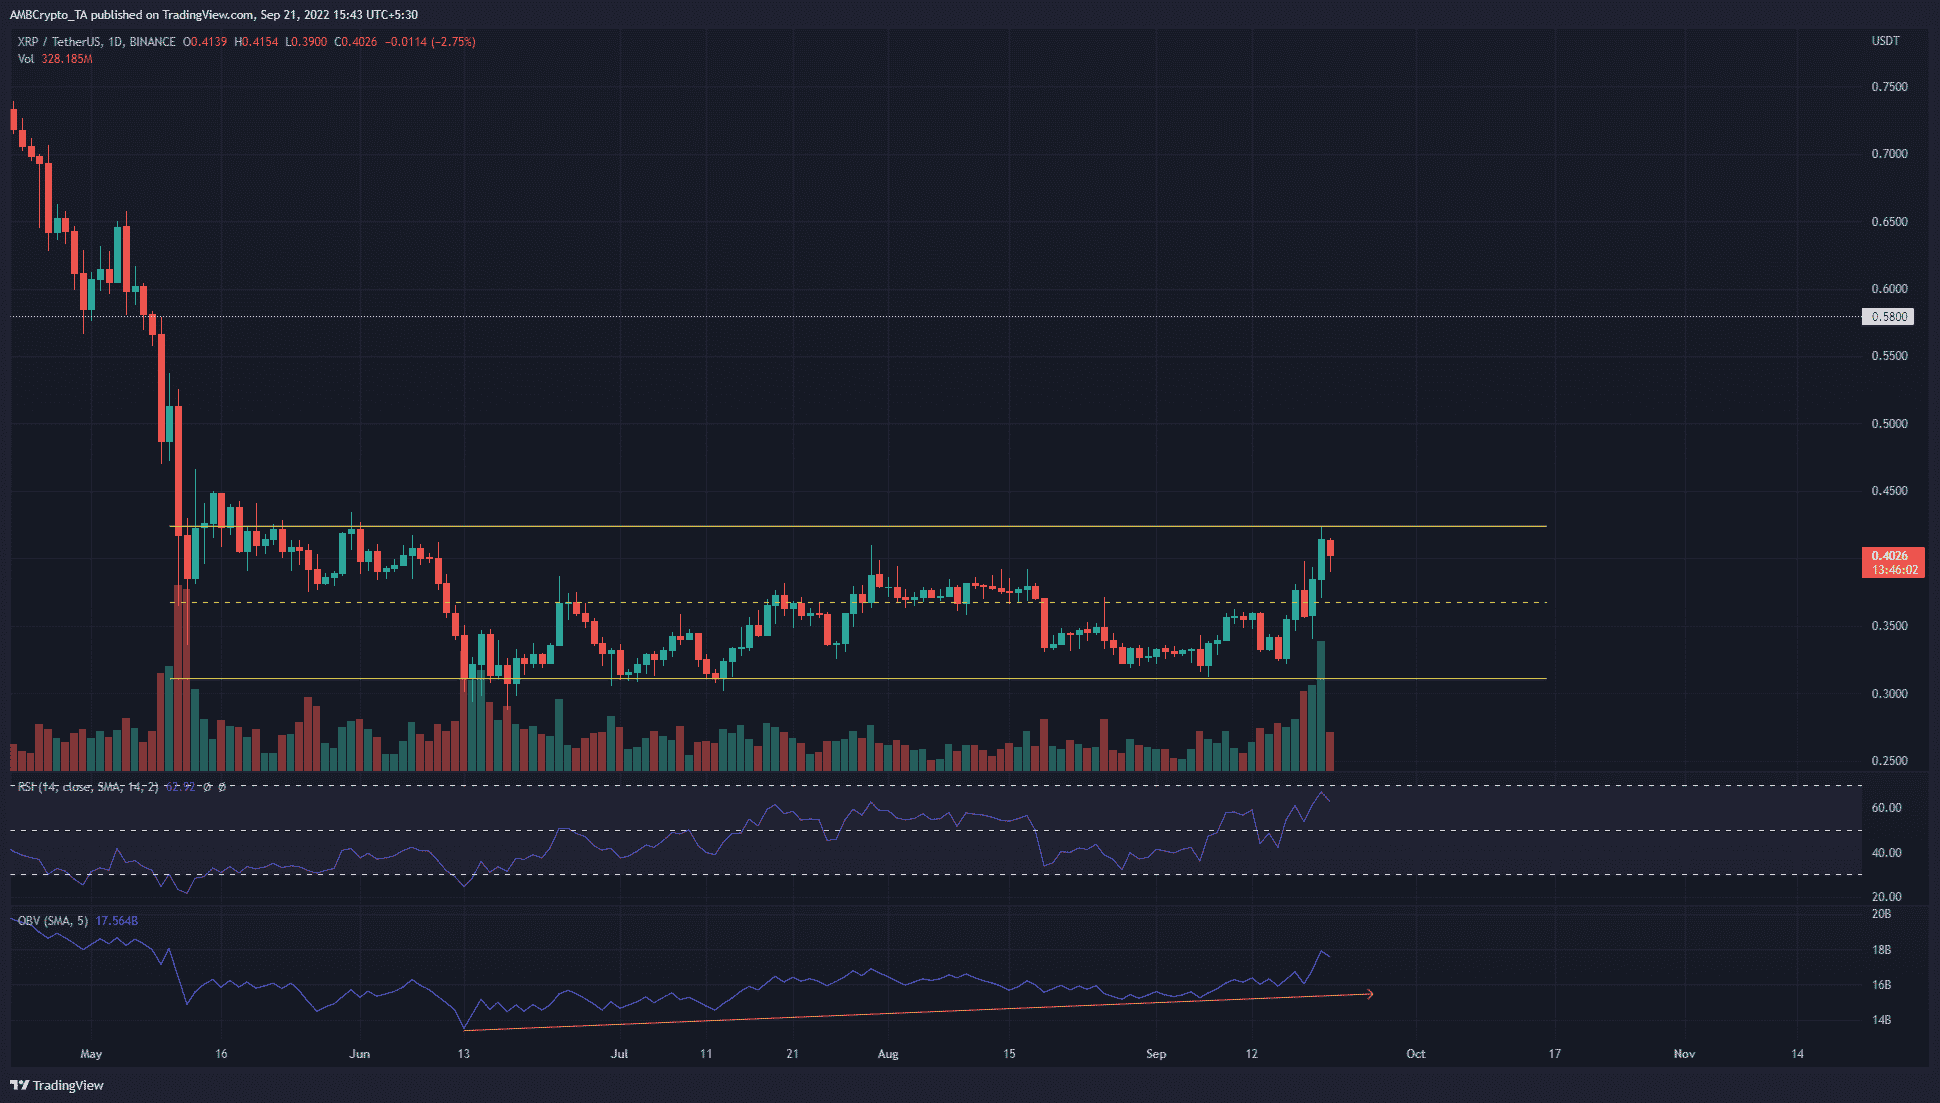
On the daily timeframe, the market structure has already assumed a bullish bias. Yet, this could lull buyers into a false sense of security. A move upward to test the $0.42-$0.45 region for liquidity before a sharp drop could also occur.
The price seeks liquidity, and such a move could force short positions to close at a loss, and also convince sidelined traders that a breakout was imminent. A plummet toward $0.36 and $0.34 could force the very same buyers to sell at a loss and add further downward momentum.
While this scenario could play out, a breakout past $0.42 was what the indicators suggested. The OBV has formed a series of higher lows since mid-June and indicated steady demand behind XRP. The RSI was also well above neutral 50 to show heavy bullish momentum.
Conclusion
Which way would XRP lean? A revisit of the $0.42-$0.45 would be a more likely selling opportunity as a deviation above the range, rather than a buying opportunity in anticipation of a breakout. That said, the indicators showed a bullish bias.
To conclude, the risk-averse trader could opt to wait for rejection at $0.42-$0.45. Alternatively, traders who are more comfortable with risky conditions can look to enter short positions within the $0.42-$0.45 zone, with take-profit targets of $0.36, $0.34, and $0.31 and stop-loss above $0.45.


