XRP, Shiba Inu, LUNA Price Analysis: 23 January

After the market-wide sell-off, XRP picked itself up from its six-month low at $0.5489. Now, it needs to gather thrust to test the 23.6% Fibonacci level. Similarly, Shiba Inu bounced back from the $0.00001708 three-month support and found a barrier at its 4-hour 20-SMA.
On the other hand, LUNA reclaimed its golden Fibonacci level but struggled to gather trend-altering volumes.
XRP
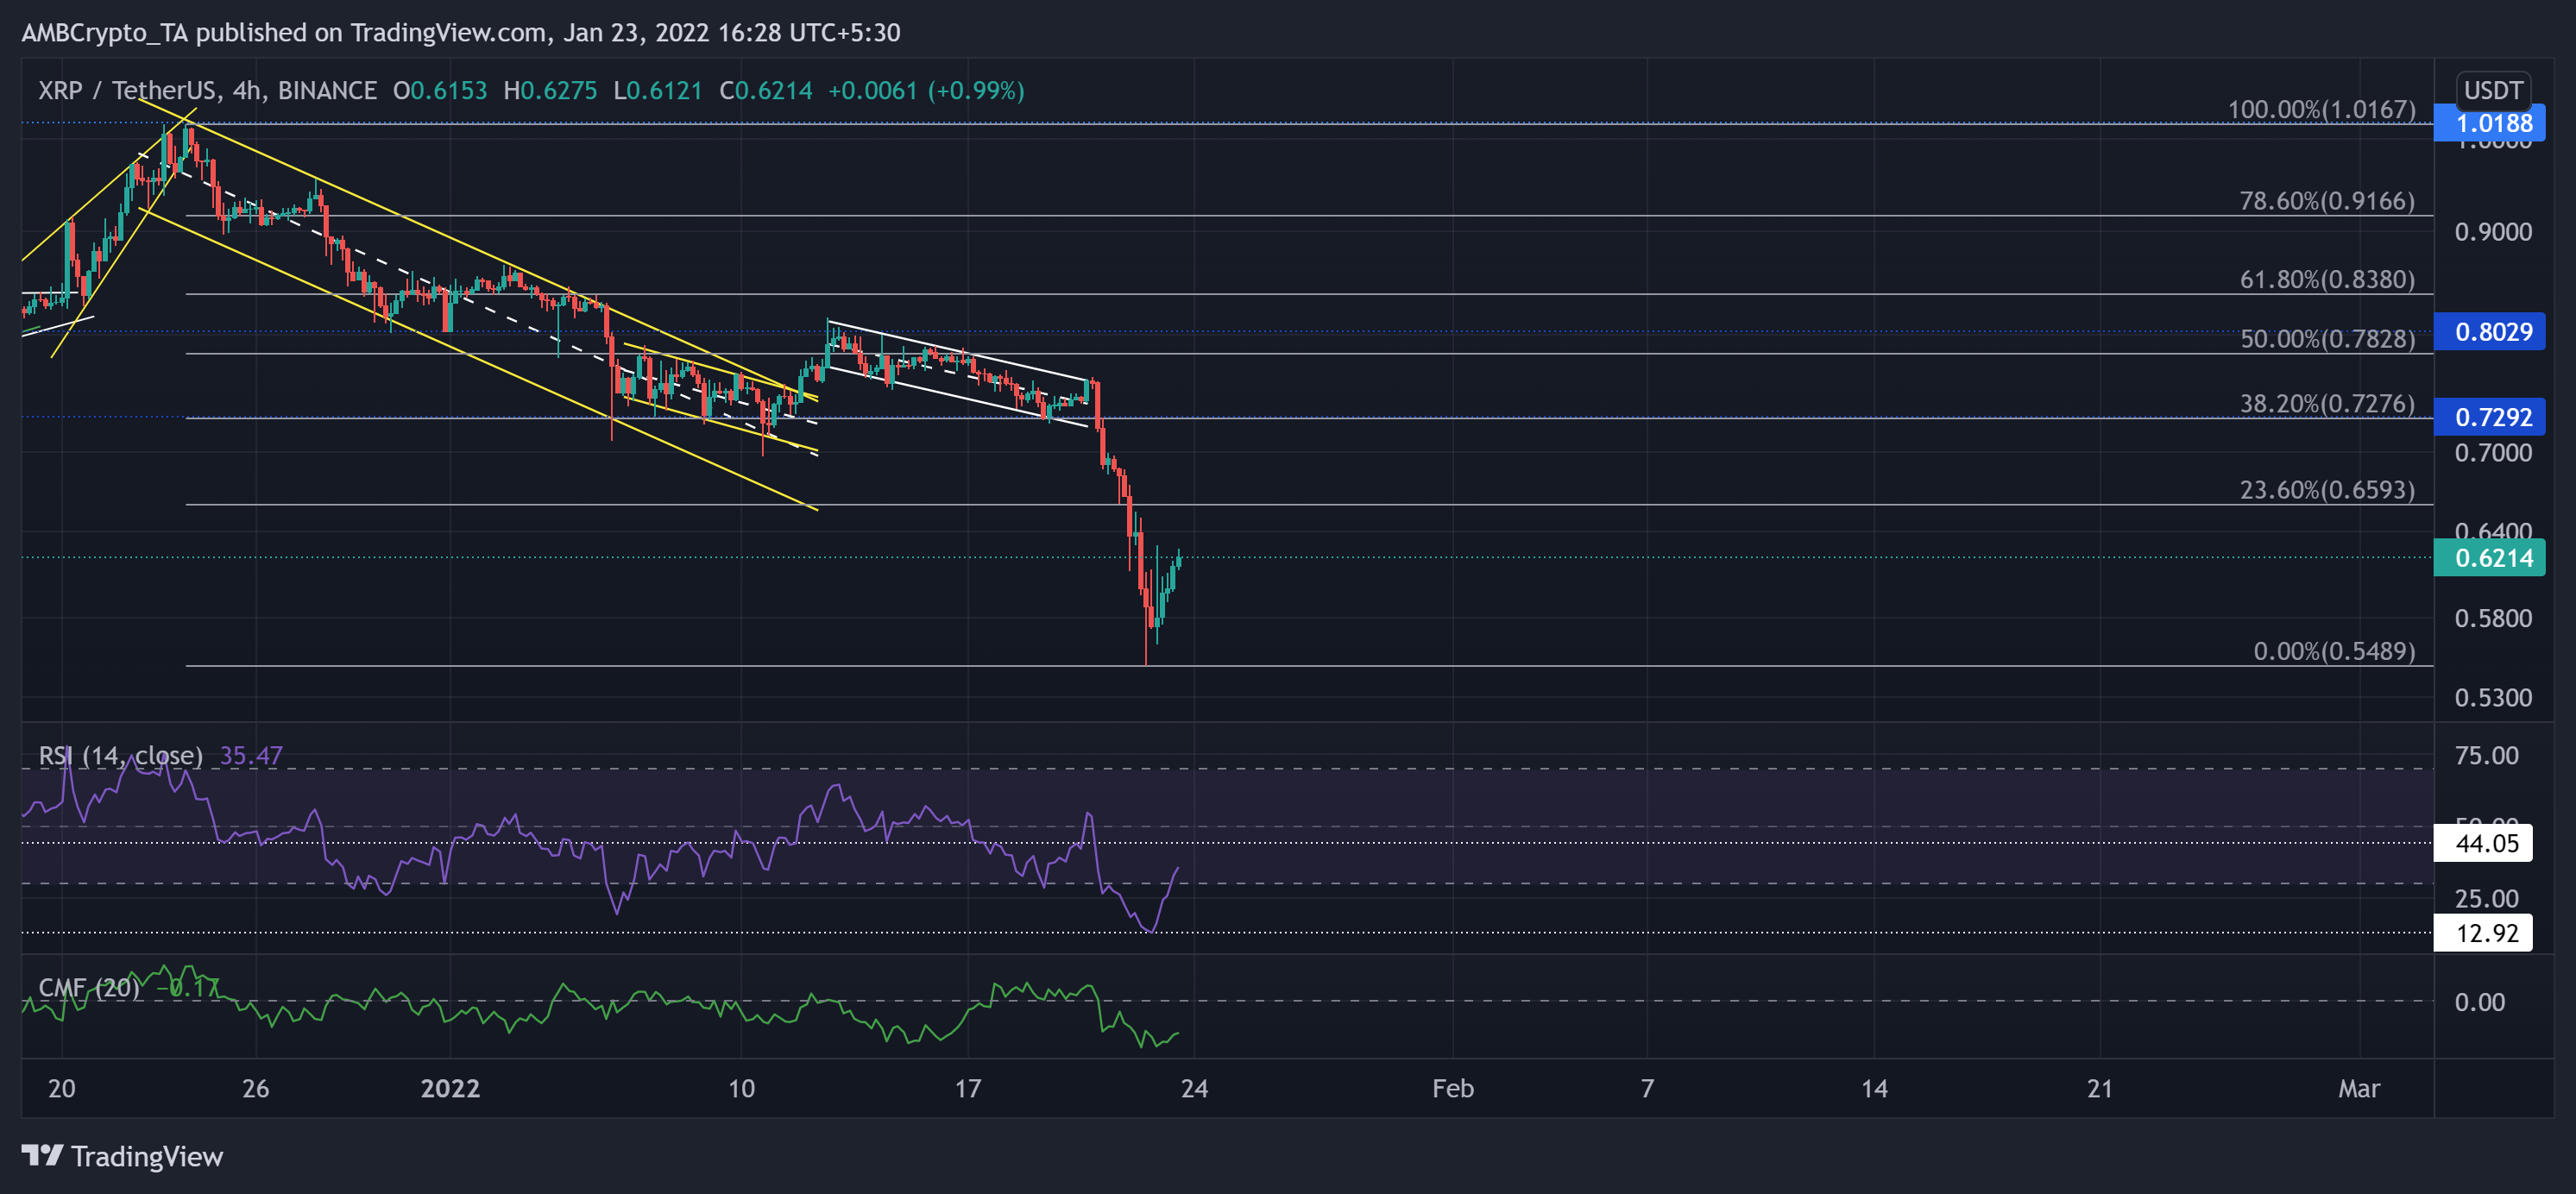
XRP managed to break out of the three-week down-channel (yellow). But, since the sellers stepped in the $0.8029-level, the alt has been on a persistent decline. Thus, it formed another descending channel (white) on its 4-hour chart.
After a bearish engulfing candlestick on 21 January, XRP steeply plunged and noted a 28.2% loss until it touched its six-month low on 22 January. Now, the 23.6% Fibonacci level stood as an immediate hurdle for the bulls.
At press time, XRP was trading at $0.6214. The bearish RSI and price seemed to be in harmony for the most part. After hitting its 13-month low, it eyed a test of the 44-mark. Also, the CMF struggled to pick up after giving an edge to the sellers. To sustain a close above the 23.6% level, the CMF needed to approach the equilibrium.
Shiba Inu (SHIB)
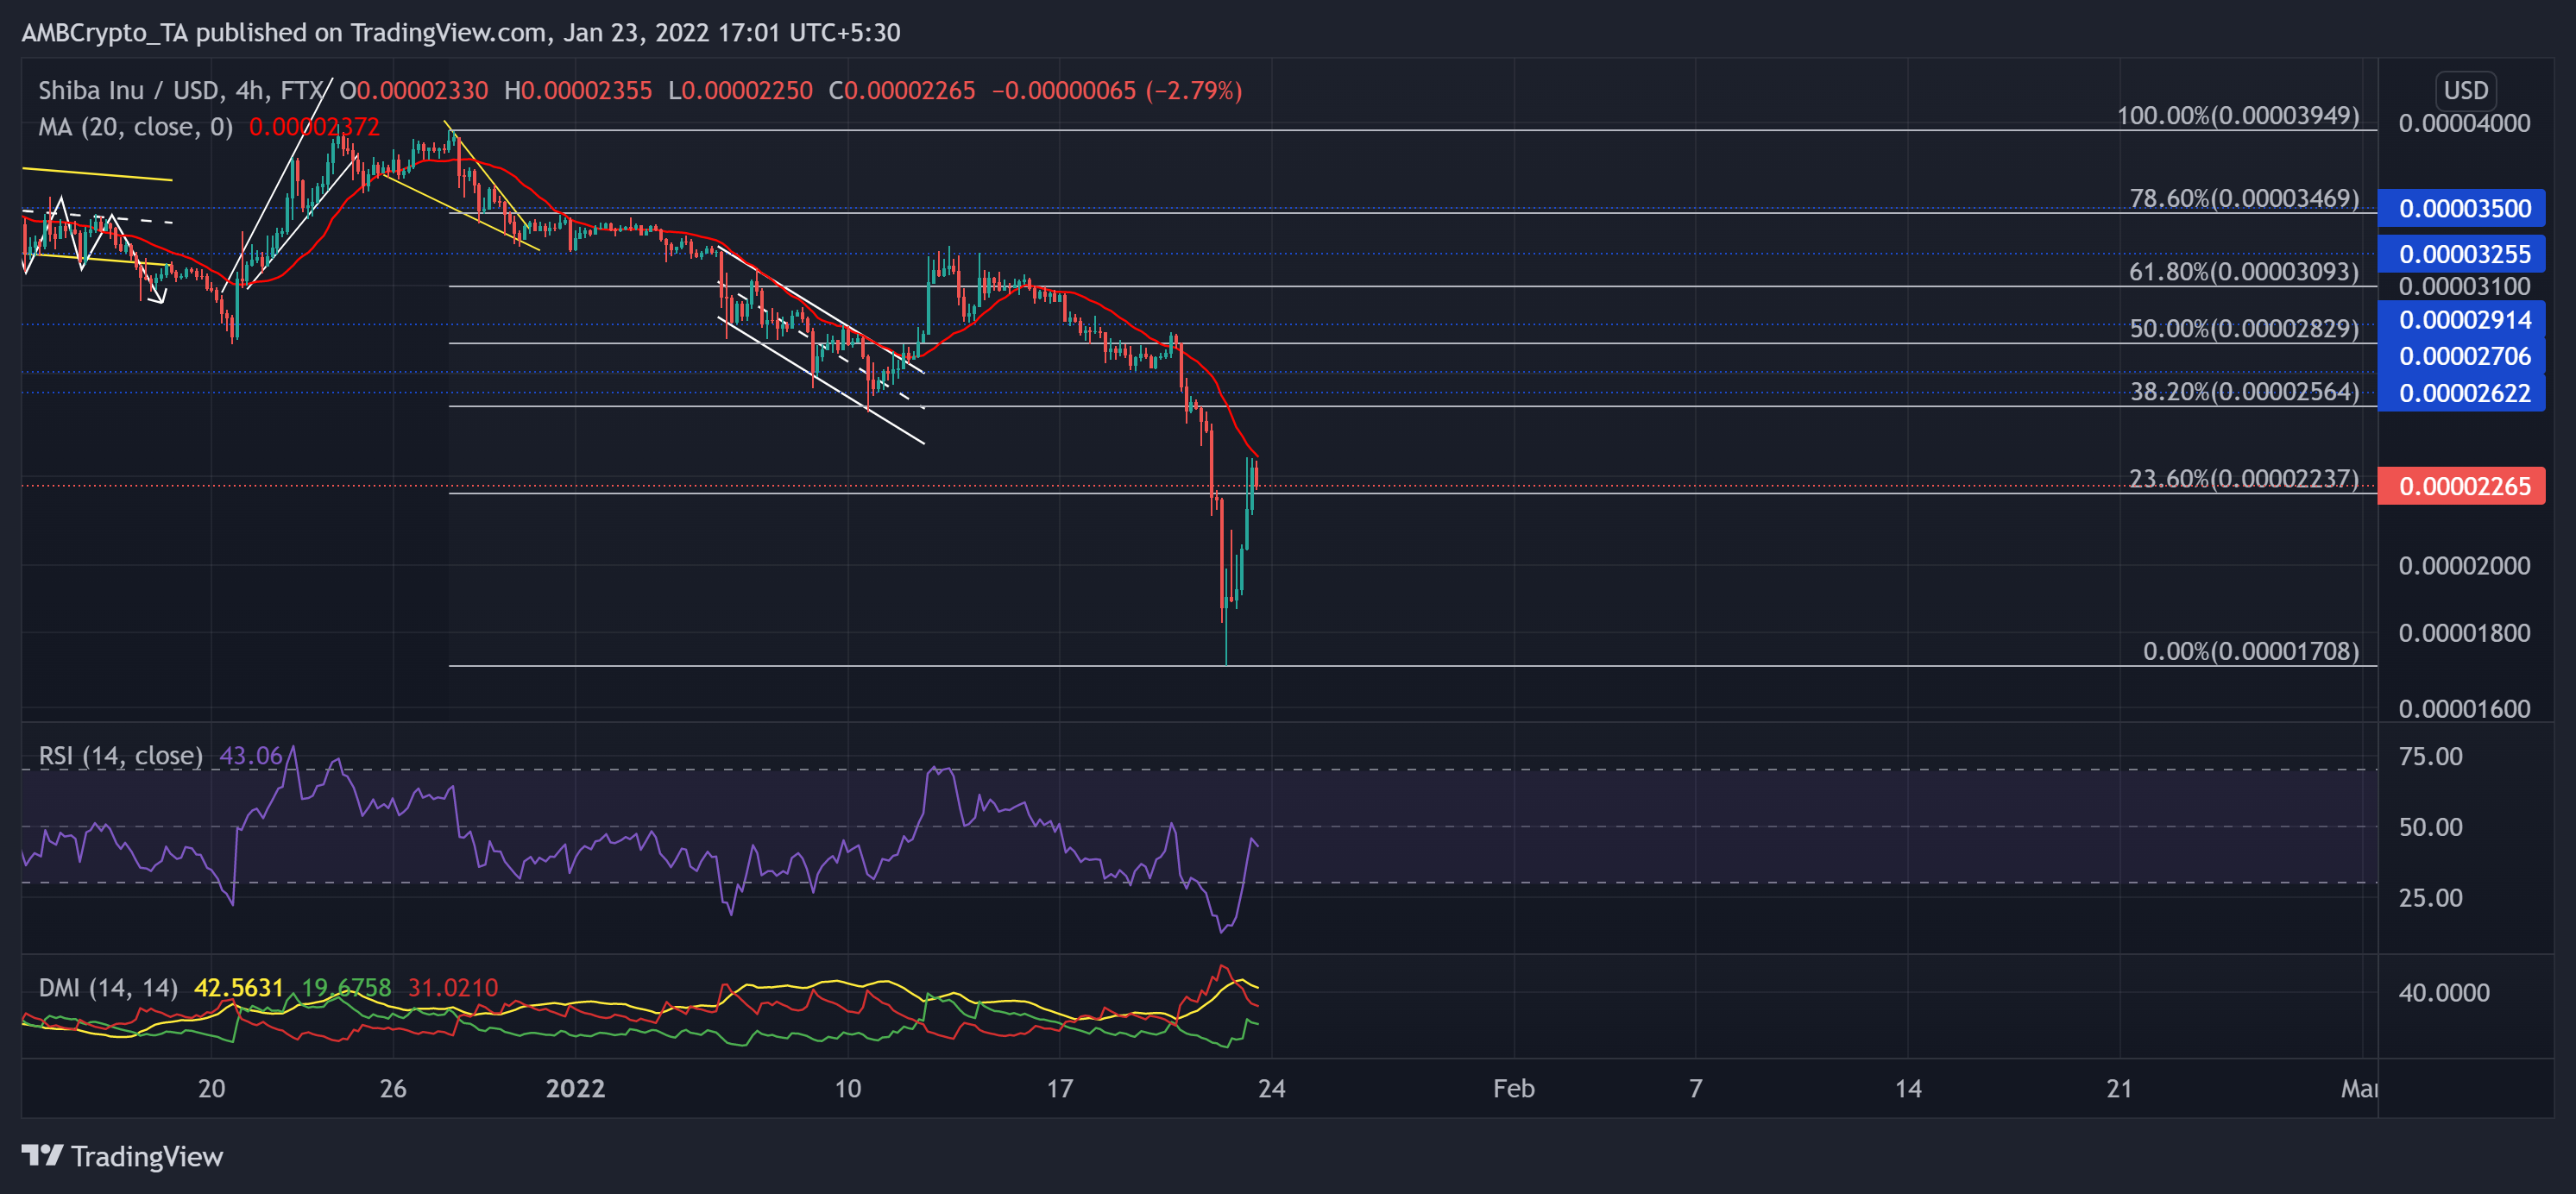
As the 61.8% Fibonacci resistance stood sturdy, the down-channel (white) breakout failed to bag in returns for the investors. Furthermore, the 21 January sell-off saw an over 39.94% retracement until SHIB nudged its 15-week low on 10 January.
Then, it saw an excellent rally after the buyers stepped in at the $0.00001708-level. As a result, it breached the 23.6% Fibonacci resistance but again reversed from the 20-SMA (red) resistance.
At press time, the alt was trading at $0.00002265. The RSI bounced back from the oversold region after touching its record low of 12.35. It revived by over 30 points in the past day but failed to cross the midline. While the bulls initiated a recovery, the distance between the +DI and -DI lessened. But the indicator continued to flash a bearish edge at the time of writing.
Terra (LUNA)
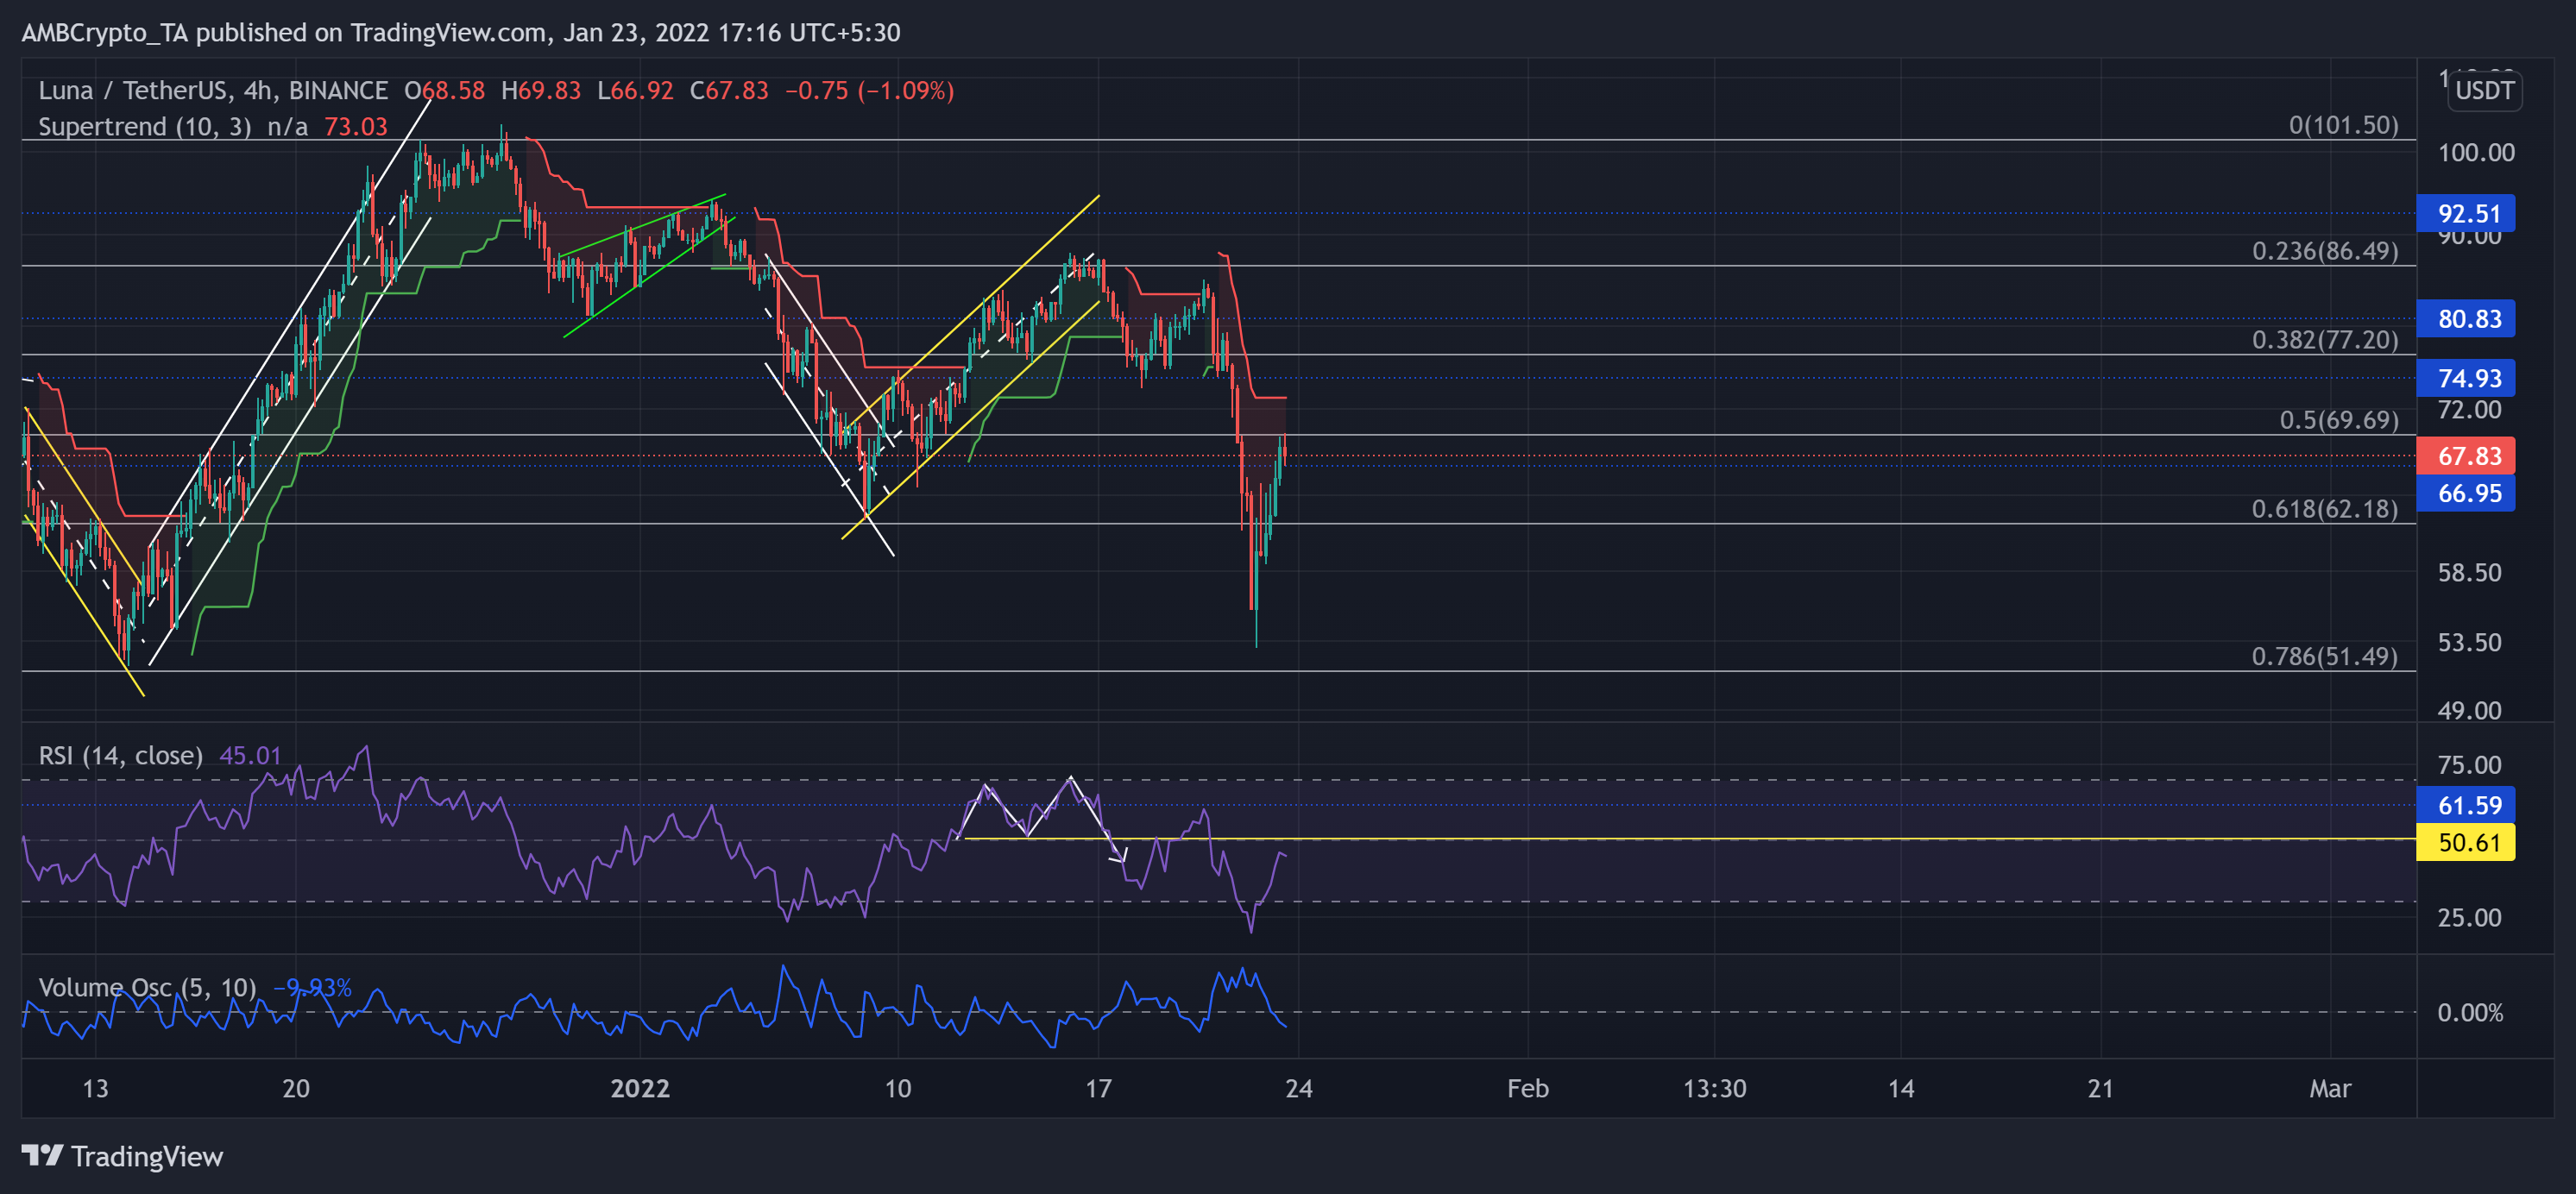
The $86.49-level resistance stood solid as the alt saw an up-channel (yellow) breakdown. Accordingly, LUNA saw a 38.06% fall (from 20 January) toward its five-week low on 22 January after losing the golden Fibonacci level.
Over the past 24 hours, the altcoin clawed back and reclaimed the 61.8%-level. Now, the testing point for the bears stood at the $66-level. Any reversals would find resistance near the $69-mark.
At press time, LUNA traded at $67.83. The RSI saw a decent incline but was yet to test the midline. To top it up, the Supertrend continued to flash a red signal. Also, it is vital to note that the Volume oscillator fell below the equilibrium during the recent recovery, hinting at a weak bull move.