XRP stalls at $0.466 after strong gains, investors must wait for…
Over the past 48 hours, XRP bulls struggled to flip the $0.46 resistance to support. It was also a higher timeframe Fibonacci retracement level- will XRP initiate a breakout over the weekend?

Disclaimer: The information presented does not constitute financial, investment, trading, or other types of advice and is solely the writer’s opinion.
- The one-hour timeframe market structure was bullish, but the daily timeframe was bearish.
- Lowered volatility on weekend could explain the tightening Bollinger Bands.
Ripple [XRP] has performed well over the past few days. A recent report highlighted that the daily timeframe market structure was bearish despite the bounce from the $0.423 support. The CVD also showed steady demand recently.
Realistic or not, here’s XRP’s market cap in BTC’s terms
Over the past 48 hours, XRP bulls struggled to flip the $0.46 resistance to support. It was also a higher timeframe Fibonacci retracement level. Further north, the $0.481 level is also expected to pose resistance.
Will XRP bulls push past the $0.466 resistance?

The daily timeframe bias was bearish, as the market structure remained bearish. But the one-hour chart exhibited a bullish structure after the 103% move upward on 17 May. Since then, the RSI was also above the neutral 50 mark.
At the time of writing, it showed a heightened chance of slipping below the 50 mark. This likelihood was due to the findings from the OBV. On the recent rally, the OBV faced a local resistance level. However, the bulls could push past it. Yet, over the past 24 hours the OBV began to slowly descend beneath this level.
If it did fall below, it would highlight heightened selling pressure. XRP could be forced to post losses and the RSI would subsequently reflect losses as well. The Bollinger Bands tightened around the price as well, indicating a phase of compression.
This could be followed by an expansion, although the direction was not clear yet. Monday’s high and low could shed light on this, and risk averse traders can wait for Monday before laying trading plans for the week.
Is your portfolio green? Check out the XRP Profit Calculator
Positive funding rates showed longs were in the majority
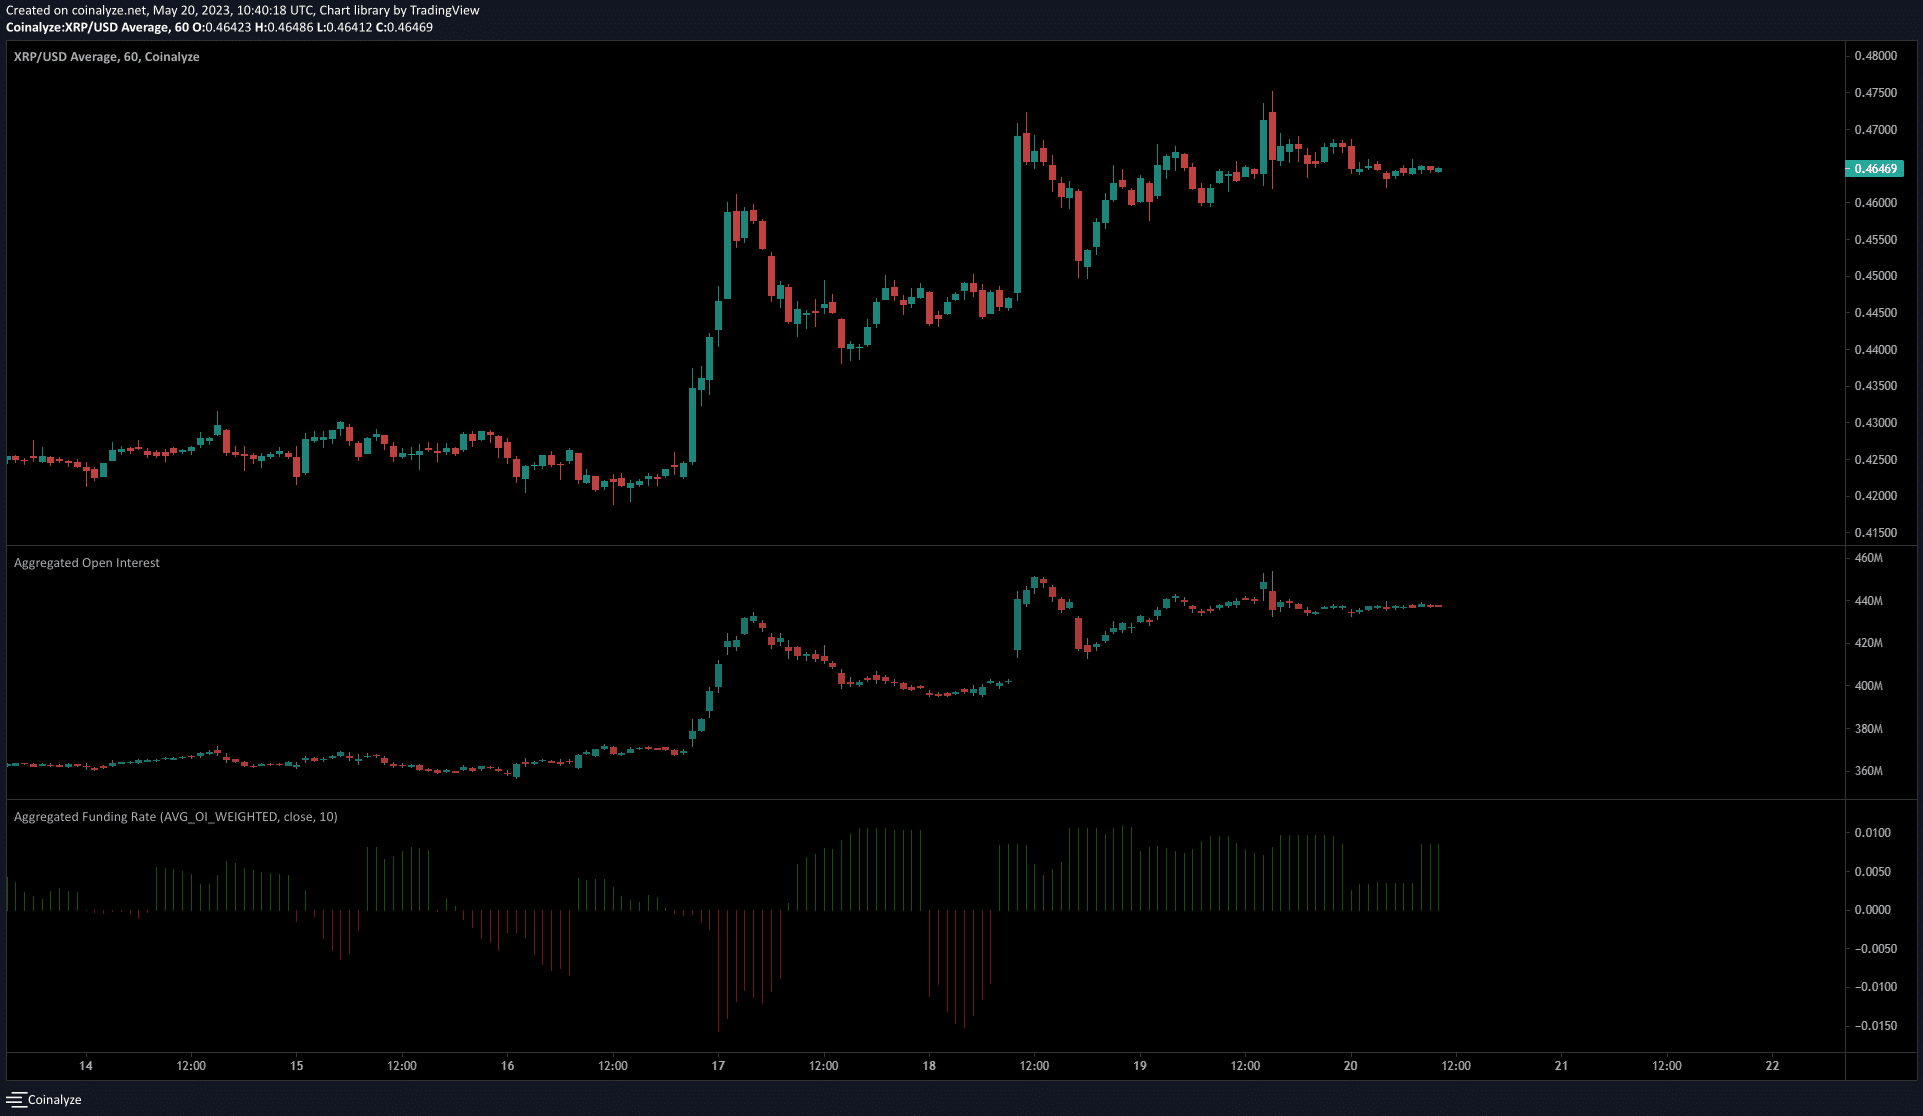
Positive funding rates do not mean speculators are bullish by themselves. It does, however, suggest that most of the futures market was long, and were willing to pay funding to the bears for their exposure.
The Open Interest has been completely flat over the past 12 hours. Therefore, traders can wait for rejection or acceptance at the $0.466 level before deciding. Meanwhile, a bearish market structure break on the one-hour chart can short XRP. This was the scenario suggested by the recent OBV developments.