XRP, Tezos, Axie Infinity Price Analysis: 07 November

Bitcoin and all the major altcoins, including XRP, were trading in green over the past day. Consequently, altcoins like Tezos and Axie Infinity (AXS) mimicked them as they registered gains on their daily charts. However, near-term technicals for both the cryptos pointed at possible ease in bullish vigor.
On the other hand, XRP showed positive signs in the near term.
XRP

After plunging to its four-week low on 27 October, XRP bulls triggered an uptrend as the price action witnessed a nearly 10.3% Weekly ROI. As a result, the price broke its immediate resistance at $1.2260 to touch its two-month high on 4 November. However after that, the price action saw a slight pullback as bears tried to exert pressure.
However, the near-term technical indicators favored the bulls by hinting at decreasing selling power. At press time, XRP traded at $1.1935 after noting a gain of 5.51% in the last 24 hours.
The RSI was northbound and stood at the 60-mark after surging by 17 points from below the midline. This reading visibly indicated increasing buying power. Additionally, the AO and MACD histogram flashed green signs and corresponded with RSI observations. Nevertheless, the ADX level displayed a considerably weak directional trend.
Tezos (XTZ)
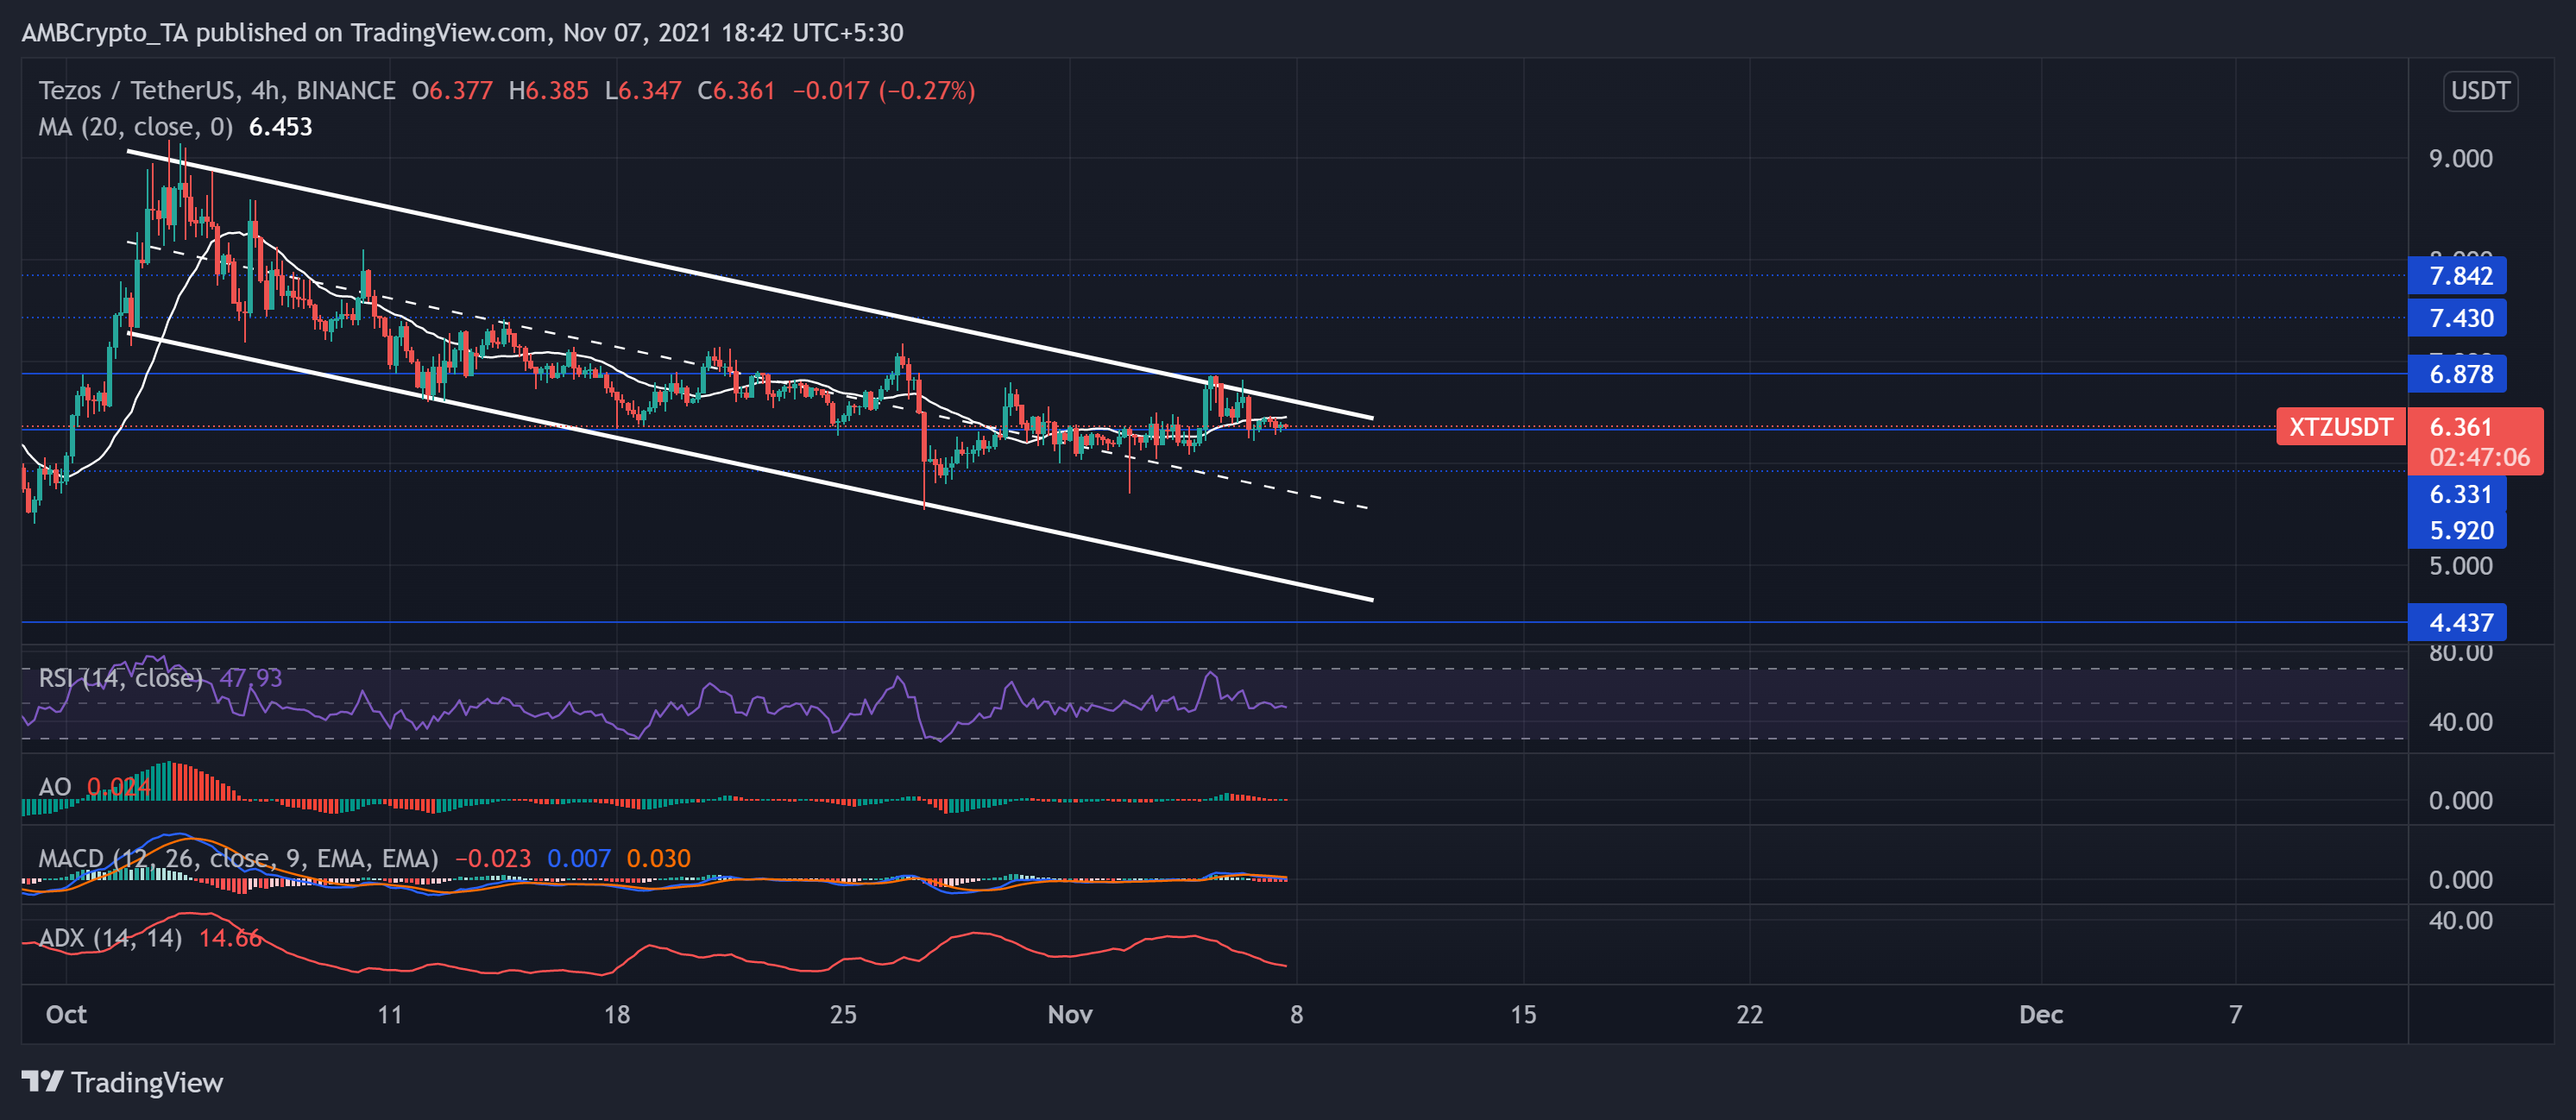
The self amending blockchain’s native token XTZ underwent a bearish momentum since 3 October. The price action oscillated between two parallel lines heading south. Thus, the digital currency registered a loss of nearly 16.67% on its monthly charts. Consequently, XTZ touched its one-month low on 28 October and bounced between the parallel lines following the trend.
Further, near-term technical indicators obliged the above readings by hinting at decreasing buying momentum. At press time, XTZ traded at $6.361.
The RSI was below the half-line, looking to head south. Additionally, the AO and MACD histogram showed red signs slightly preferring the sellers. Nonetheless, the ADX level displayed a considerably weak directional trend.
Axie Infinity (AXS)
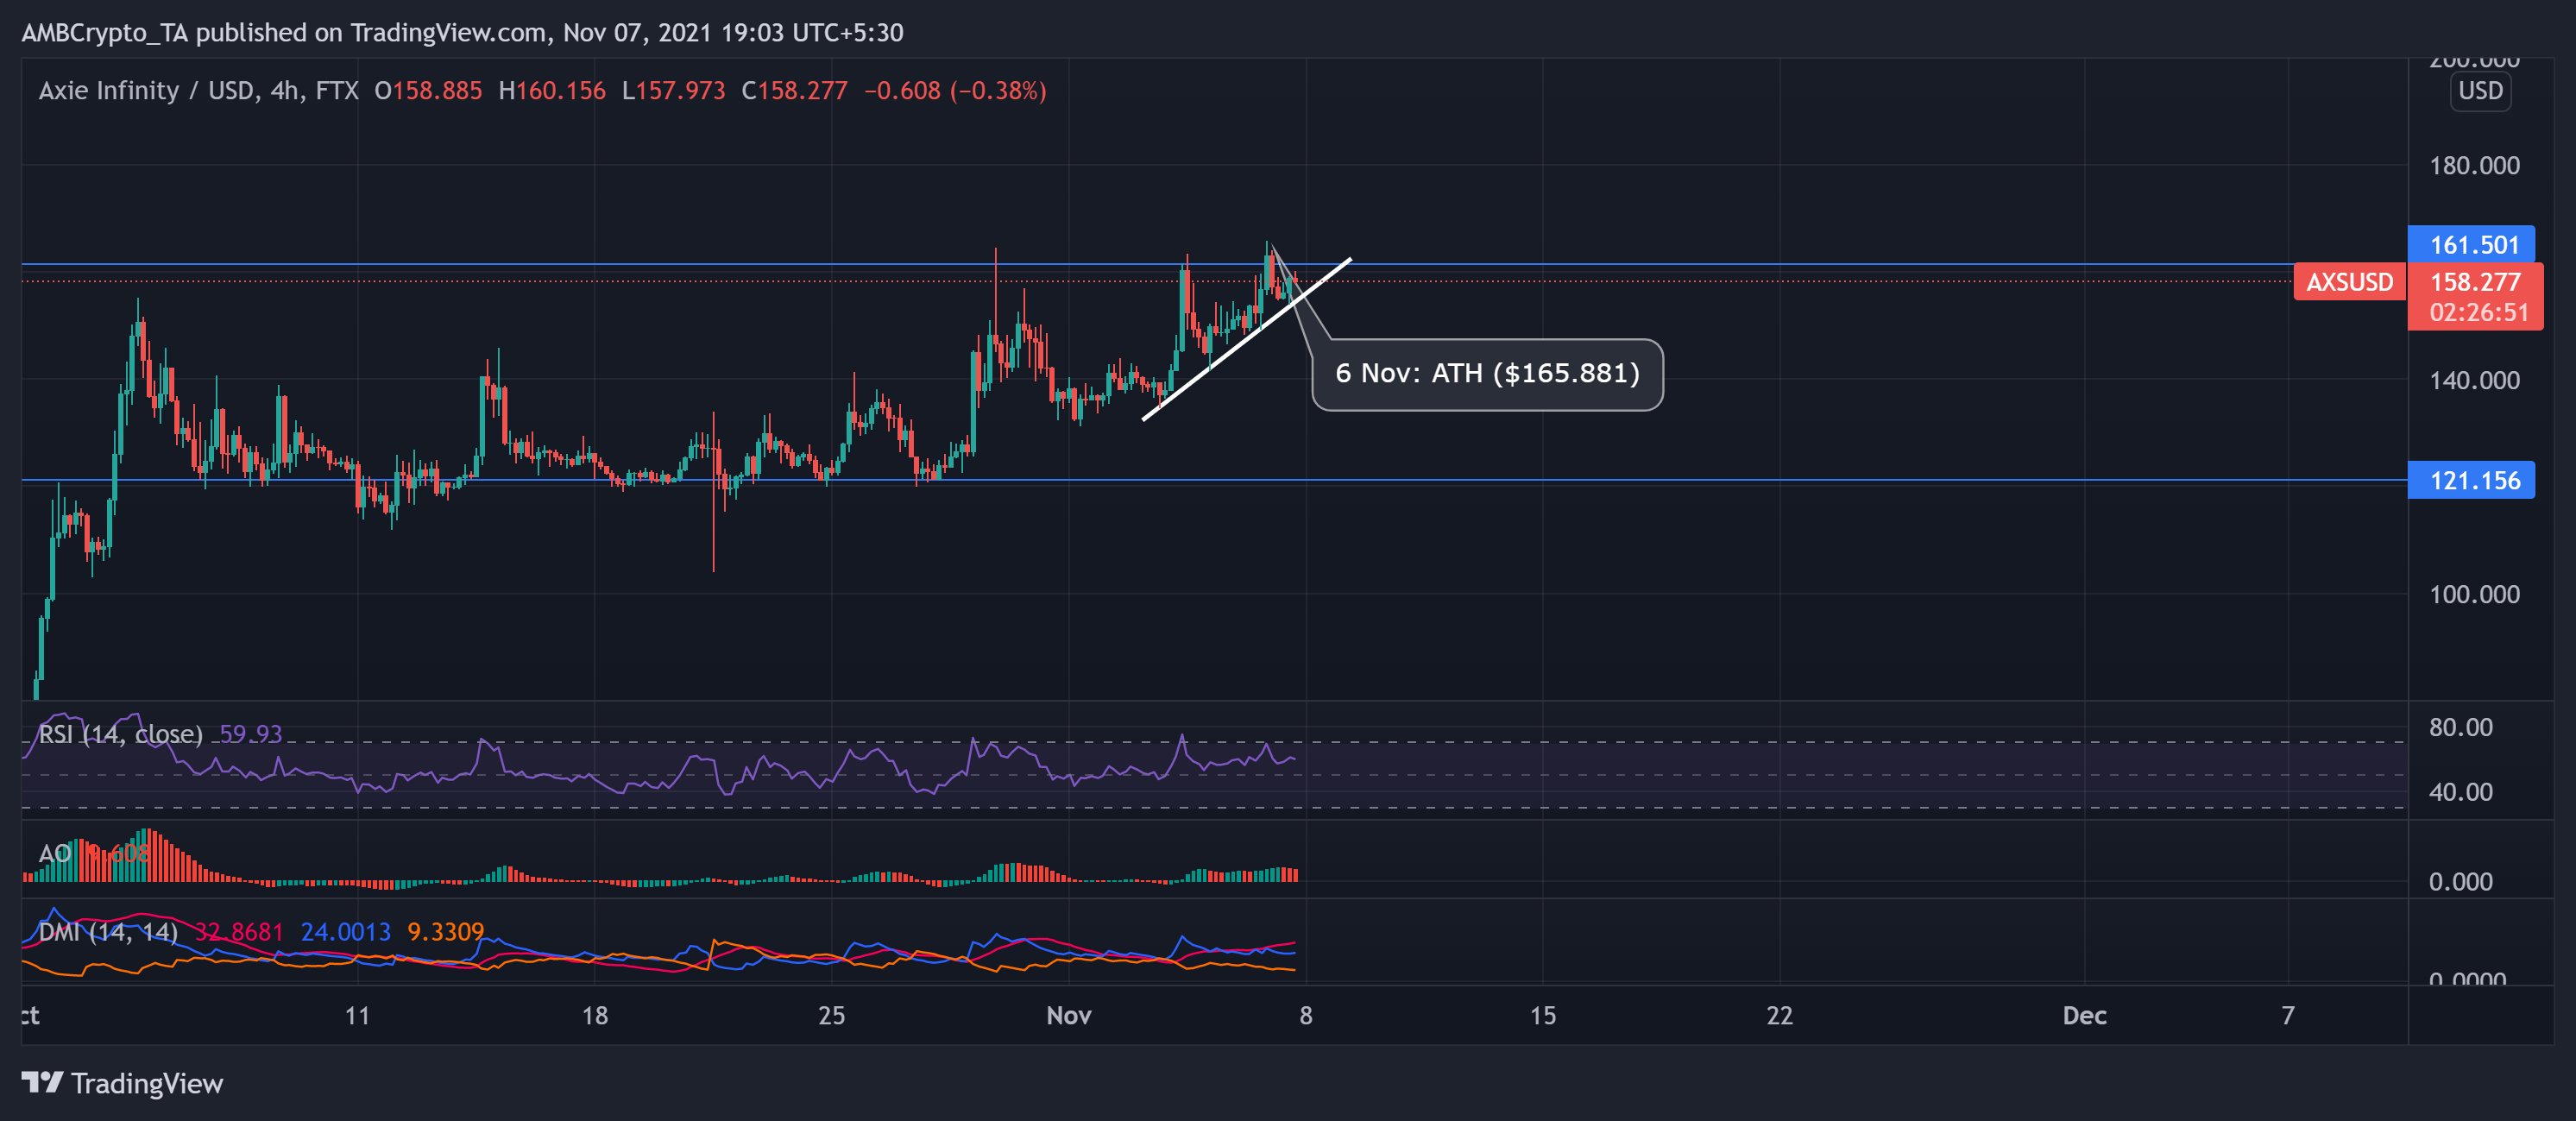
The Ethereum-powered gaming crypto noted a 4.61% gain on its charts in the last 24 hours. Over the past month, AXS fluctuated between $121.156 and the $161-mark until it reached its ATH on 6 November. AXS bulls exerted constant pressure while the bears showed resistance at the $161-mark. At press time, AXS traded at $158.277 after noting a 15.32% gain over the past week. If the Bulls continue to counter the bears with increased momentum, they could breach the $161-mark.
However, the near-term technicals suggest decreasing bullish power.
The RSI stood above the midline after plunging by 10 points over the past day. This reading depicted a decreasing buying strength in the near term. Furthermore, the AO flashed red signals and confirmed the previous observations. Nevertheless, the DMI lines exhibited an inclination for buyers with a high ADX level.


