XRP to break out of a bull pattern – Here’s why it should interest you

- XRP’s daily chart was red at a time when its price was exiting a symmetrical triangle pattern.
- Market indicators remained bearish on the token.
The bullish market condition has turned the weekly charts of most coins green, including that of XRP. However, the token’s daily chart turned red. But things might again turn in the token’s favor, as it was on the verge of breaking above a key resistance zone.
XRP is breaking above a bull pattern
According to CoinMarketCap’s data, XRP’s value surged by 15% during the last seven days. However, the token’s daily chart turned red as its value dropped by 0.5%. At the time of writing, XRP was trading at $0.644 with a market capitalization of over $35.2 billion.
Separately, World of Charts, a popular X handle that posts updates related to the crypto space, recently revealed that XRP’s price was breaking out from a bullish triangle pattern.
In fact, the tweet mentioned that the breakout could result in a 2-3x price increase for the token.
Is XRP about to reach a new ATH?
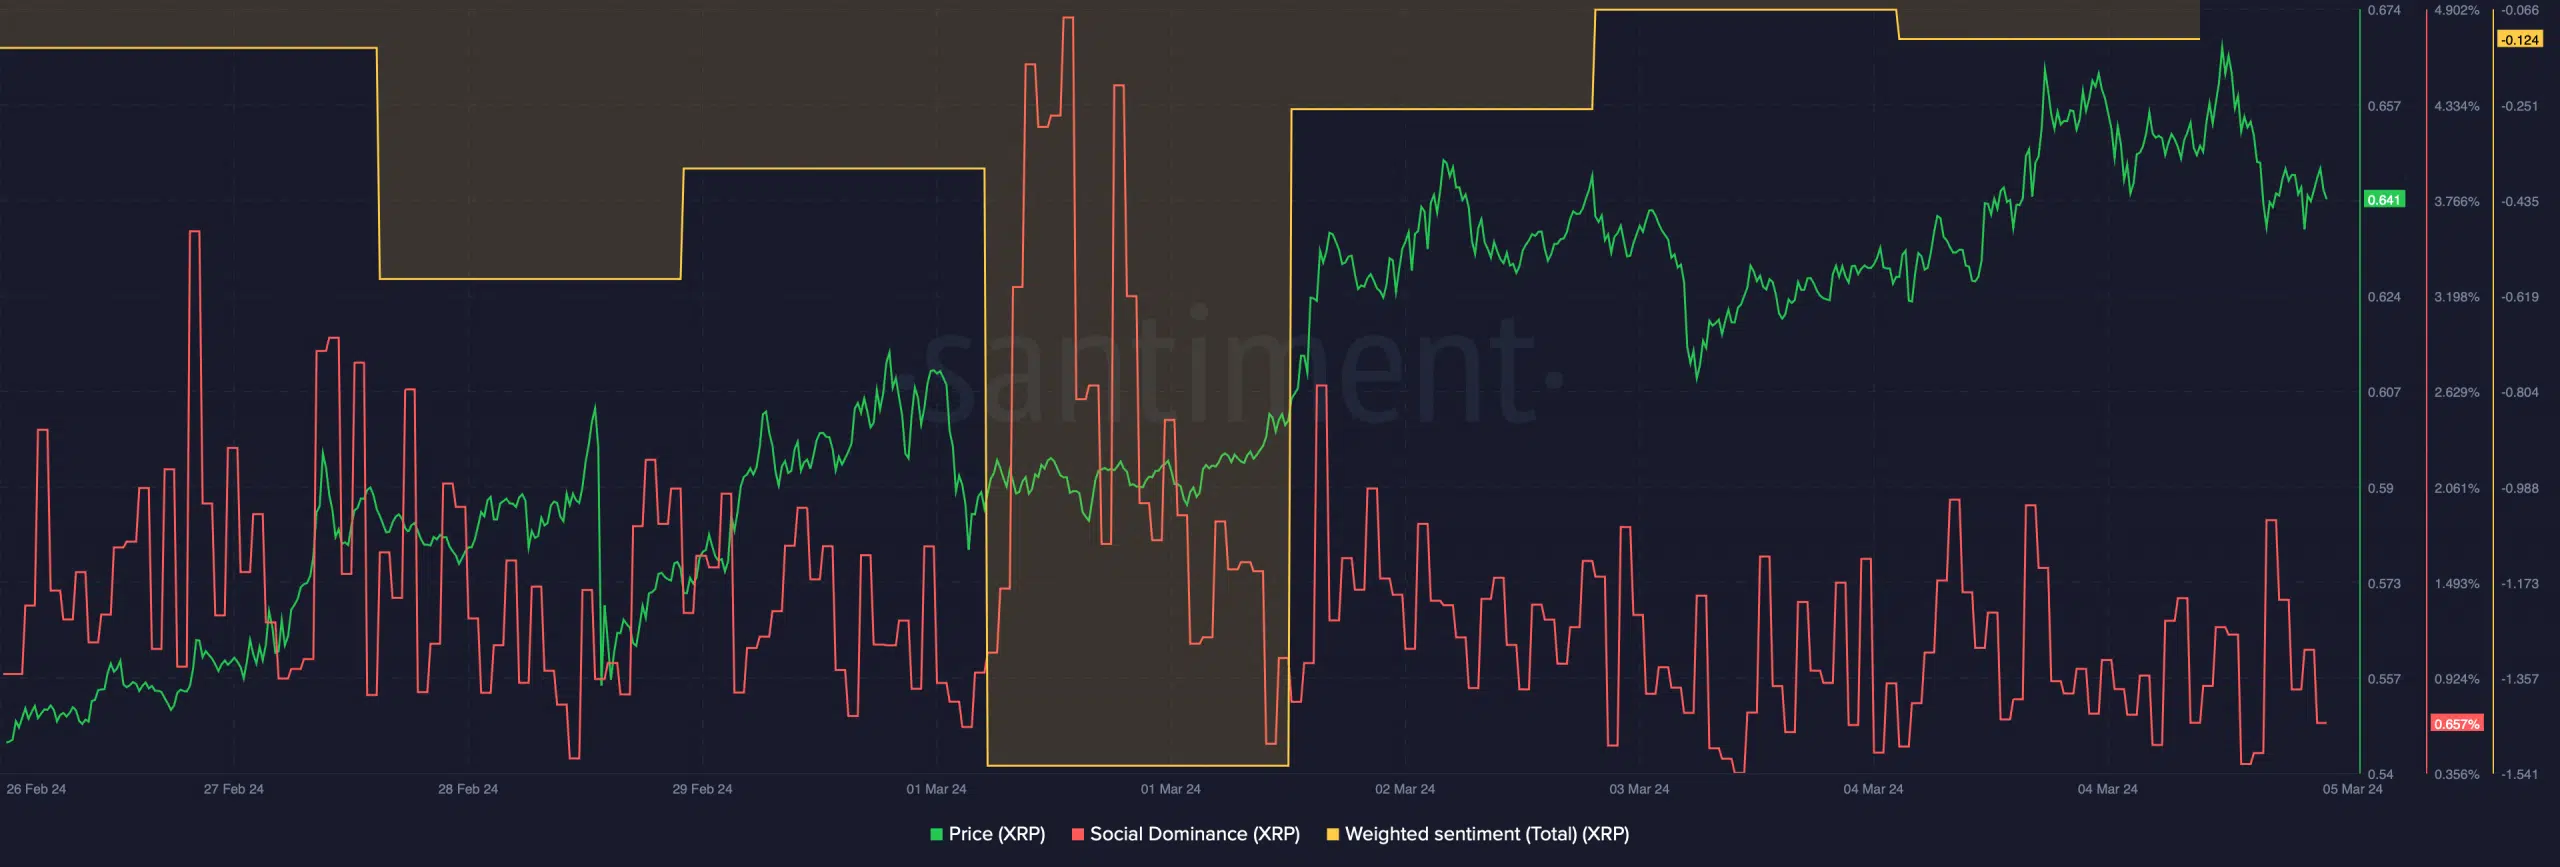
Since there was a chance of XRP reaching new highs, AMBCrypto checked other metrics. We found that despite the rise in price last week, its social dominance sank last week.
However, its weighted sentiment went up, reflecting that bullish sentiment around the token was dominant in the market.
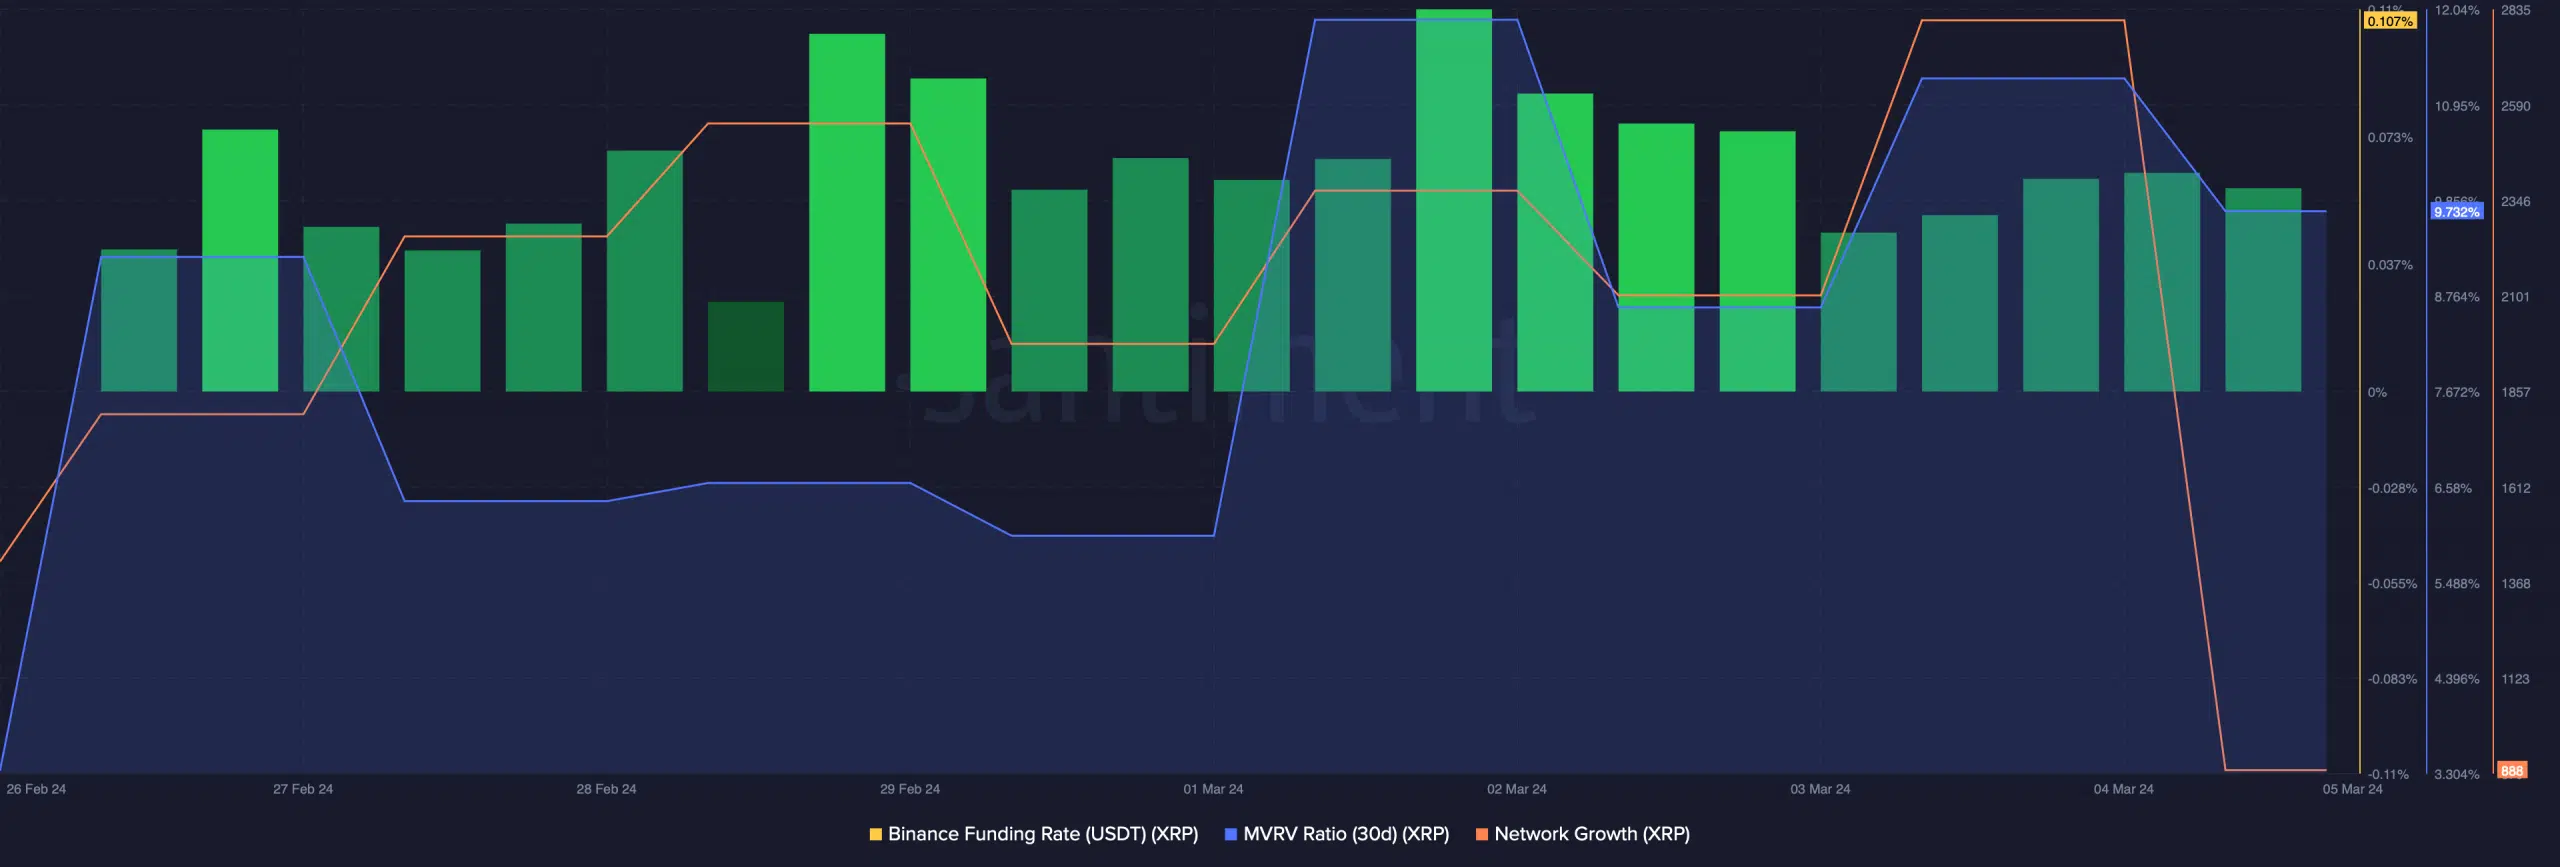
A few of the other metrics also supported the possibility of a bull rally. For instance, the token’s MVRV ratio increased last week, hinting at a price uptick.
The token’s network growth also went up, suggesting that more new addresses were created to transfer the token. Another bullish metric of the token’s funding rate, which remained green, suggests buying sentiment was dominant in the derivatives market.
Read XRP’s Price Prediction 2024-25
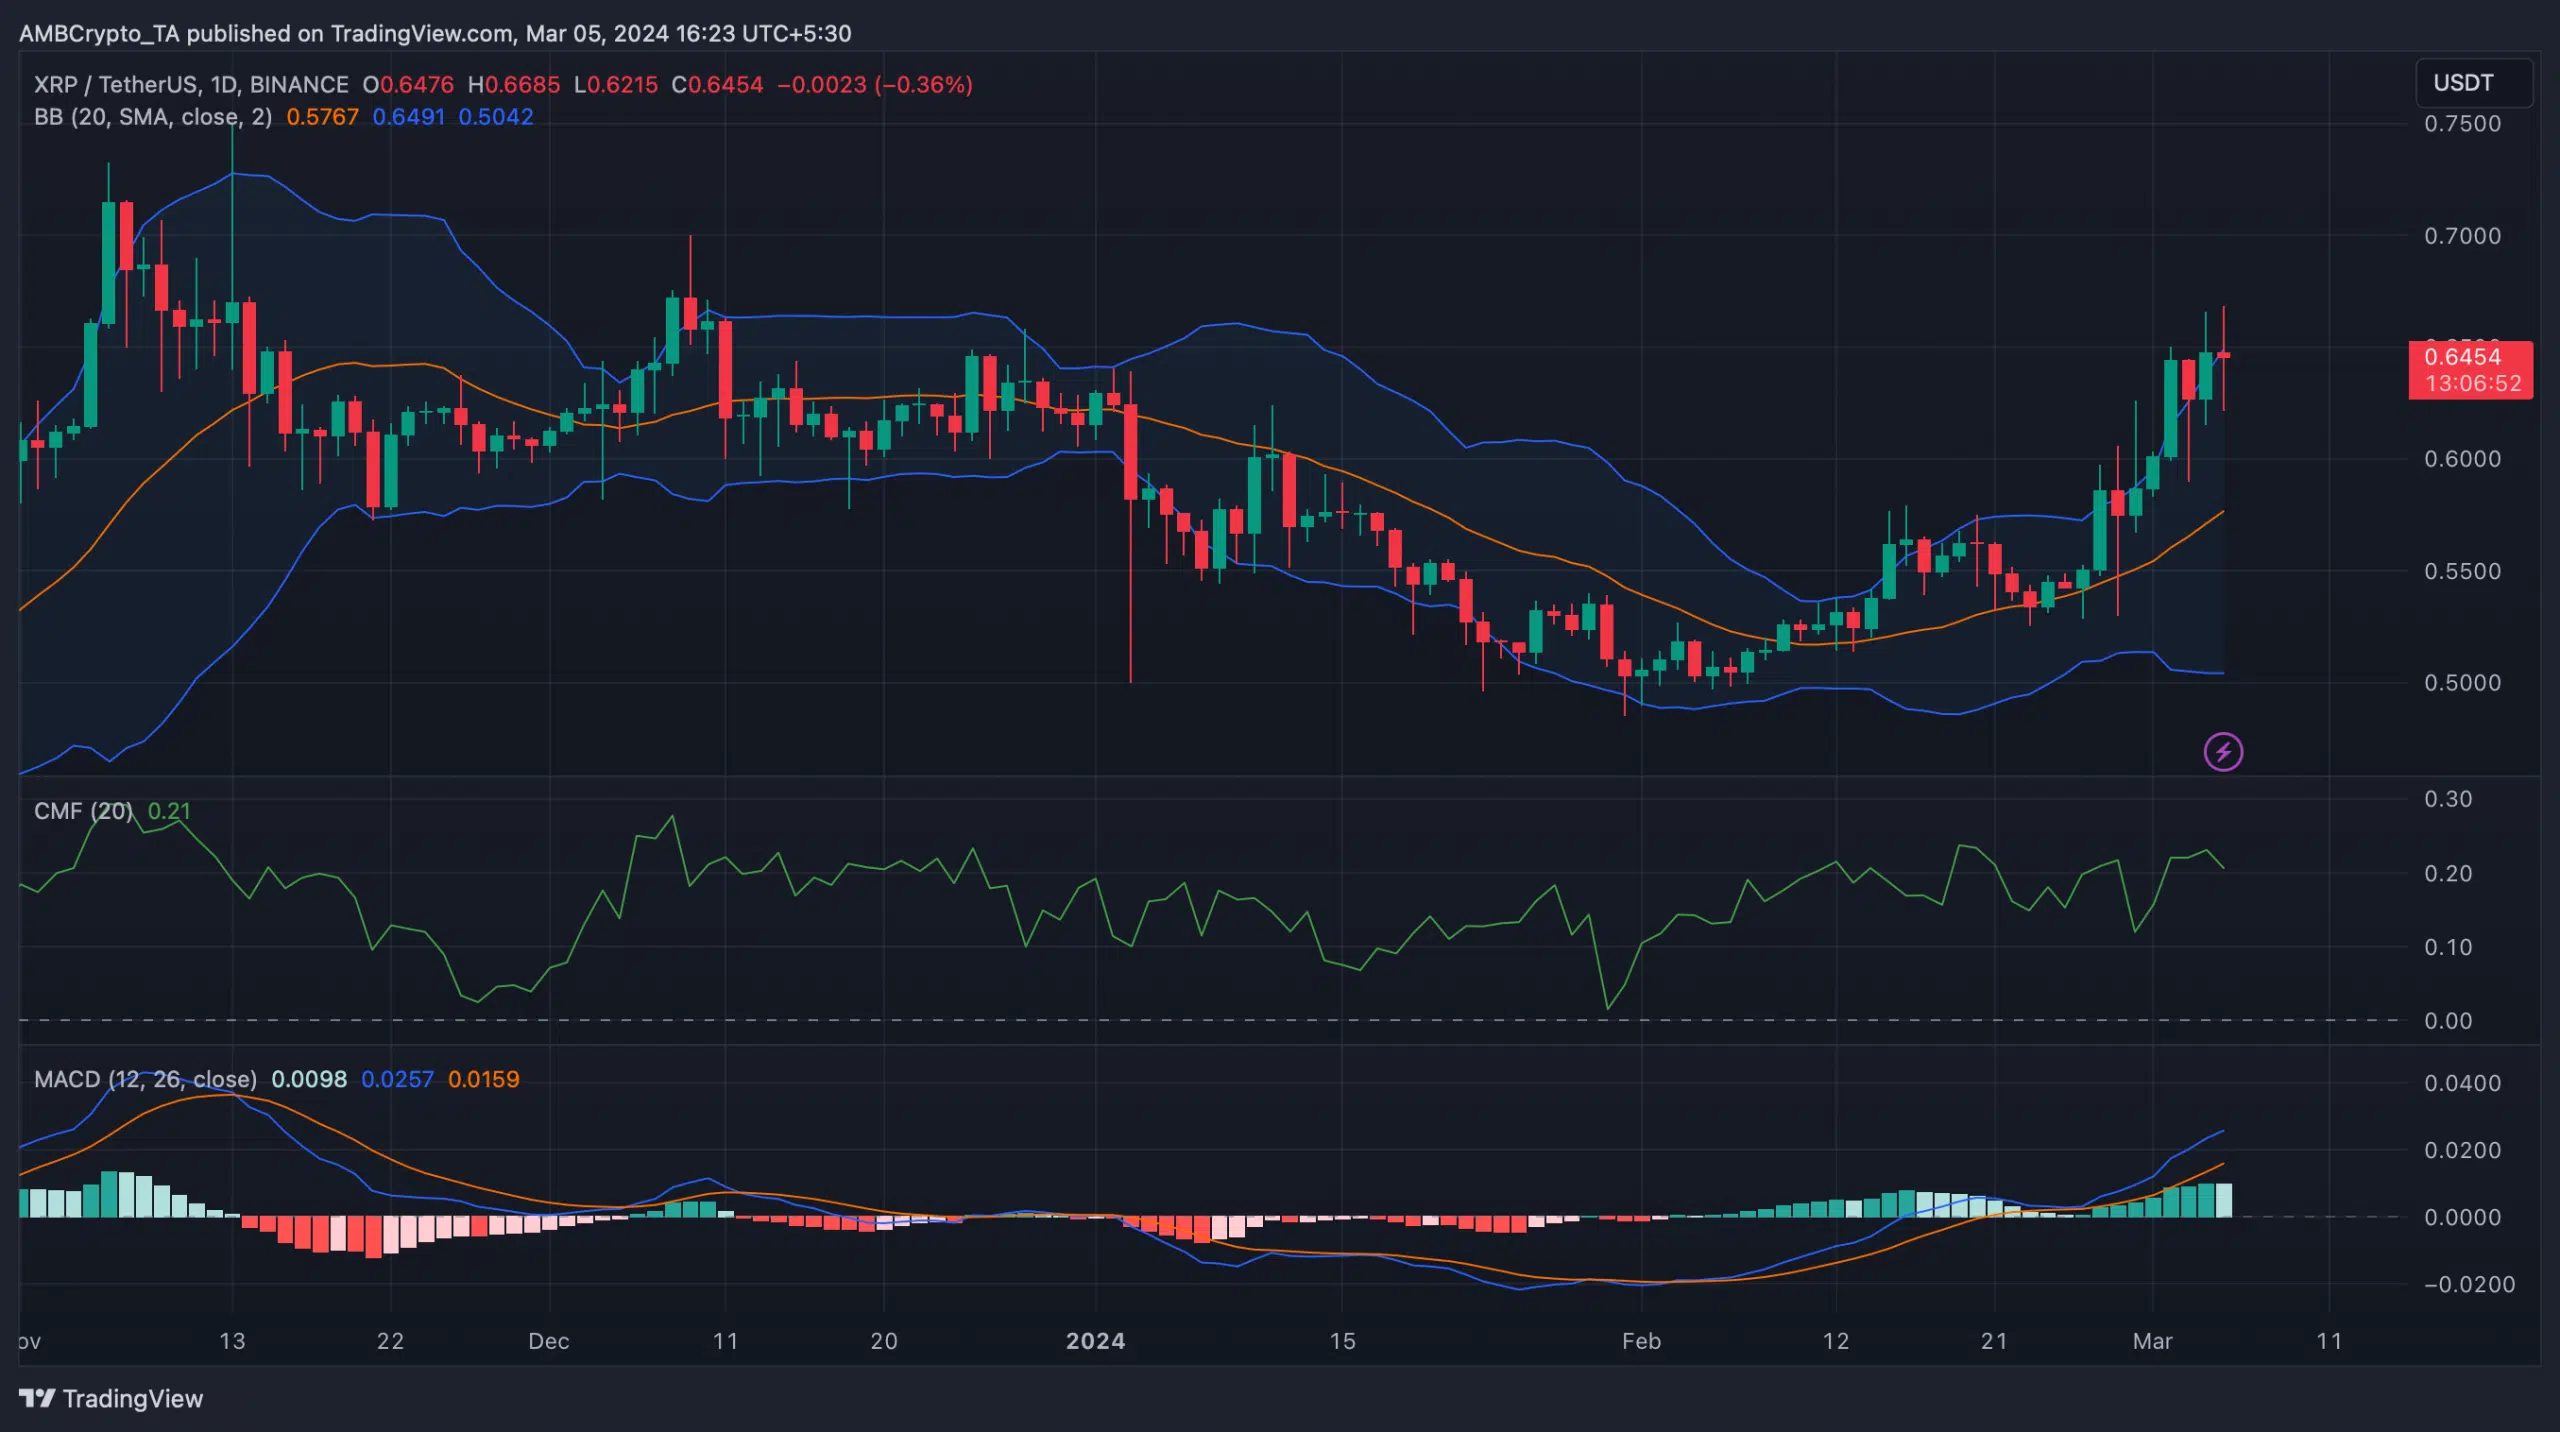
Next, we checked the token’s daily chart to see what indicators suggested regarding XRP’s possible price action. The indicators looked bearish and hinted that the chances of a bull rally were lower.
For example, the token’s price touched the upper limit of the Bollinger bands. Its Chaikin Money Flow (CMF) also registered a slight downtick, further increasing the chances of a price correction.
However, the MACD looked bullish, as it displayed a bullish crossover.


