XRP’s price may note an uptrend as coin prepares to breach ascending triangle pattern

XRP’s price rejoiced in the bullish waves from early September. However, that growth was obstructed by the bear attack. Despite the fall, the price of XRP did see some upward movement as it neared the breaching of an imminent bullish pattern.
1-hour

Source: TradingView
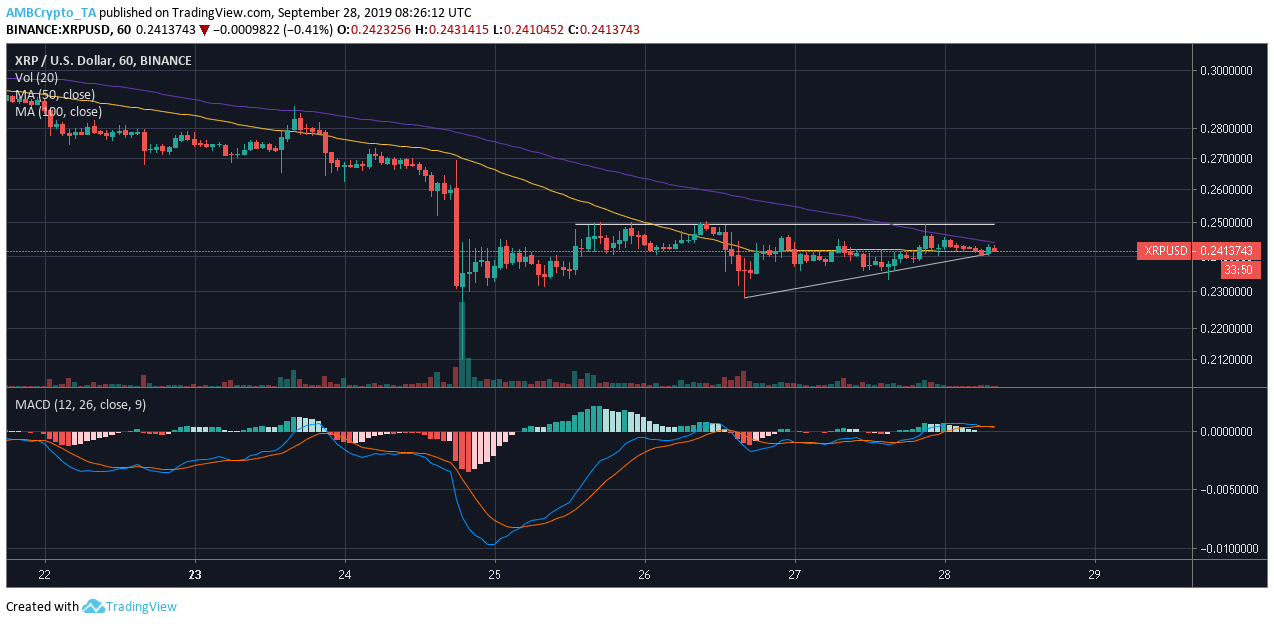
XRP’s one-hour chart led the way for the bulls with the formation of an ascending triangle. Perceived as a growth foreteller, ascending triangle comprises of two trend lines, extending across the swing highs at $0.2493, while a rising trendline marked the swing lows at $0.2276, $0.2359, and $0.2405. The consolidating price of XRP resonated with its volume and with further consolidation, the price might break out of the triangle moving upwards.
The 50 moving average lay under the 100 moving average, denoting a bear’s market. The bearish reign was affirmed by the MACD line, as it appeared under the signal line.
4-hour

Source: TradingView
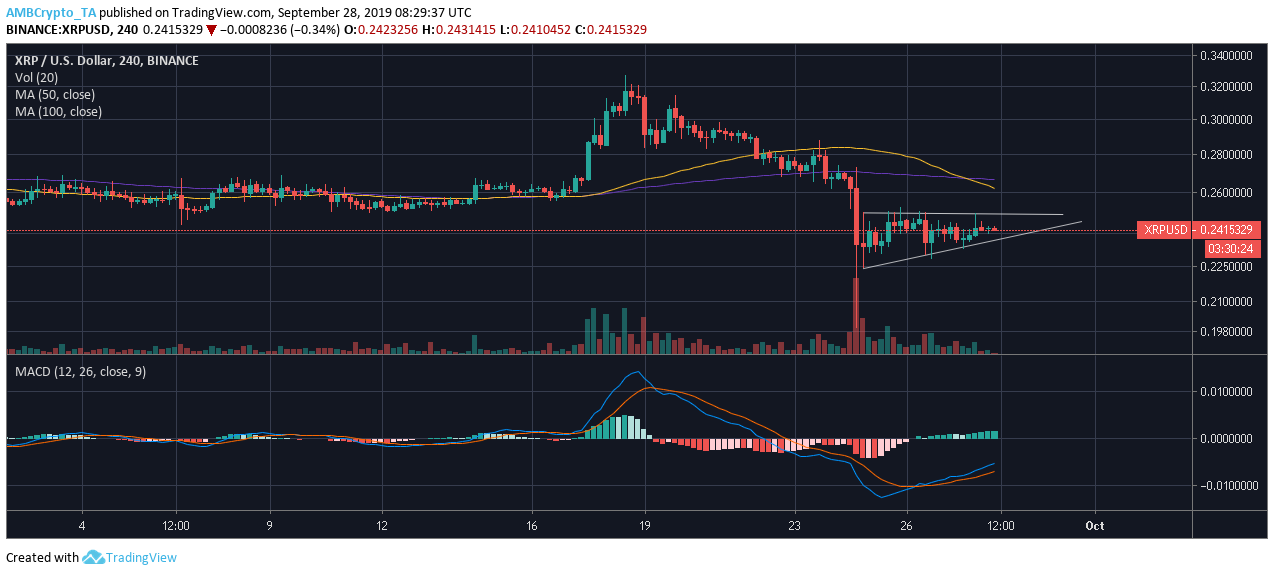
The 4-hour chart for XRP marked the formation of an ascending triangle pattern too. The base was provided at $0.2491, while the slope marked swing lows at $0.2236, $0.2303, and $0.2335. As the price moves between the two trend lines, a bullish breakout is speculated.
The 50 moving average was under the 100 moving average, giving way to the bears. However, the MACD line was above the signal line, indicating the scanty presence of bulls.
Conclusion
XRP’s price may note an uptrend as the coin prepares to breach out of the ascending triangle formation.


