XRP has been struggling below the crucial $0.30 psychological resistance point despite the recent Bitcoin rally. At press time, XRP was trading at $0.297 against the US Dollar after a minor surge of 0.17% over the past 1-hour. The third-largest coin held a market cap of $12.8 billion and registered a 24-hour trading volume of $1.93 billion.

Source: CoinStats
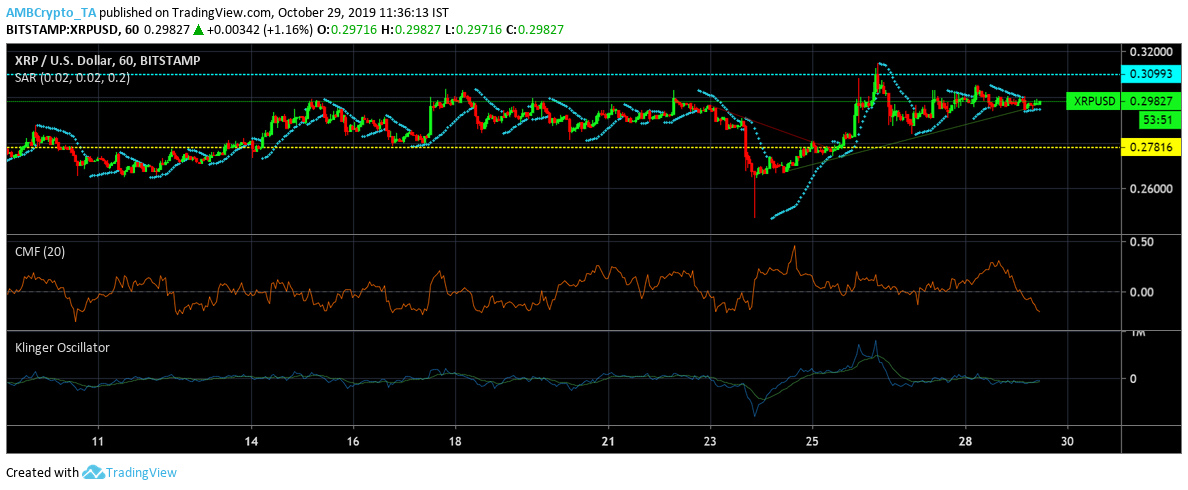
XRP 1-hour Chart:

Source: XRP/USD on TradingView
The candlestick arrangement in the hourly chart exhibited an uptrend from $0.26 to $0.29 along with a minor downtrend from $0.29 to $0.23 led by the September decline. XRP price found resistance at point $0.30 while the support rested at $0.27 for the short-term chart.
Indicators:
Parabolic SAR: The dotted markers were below the XRP price candles, this was indicative of a bullish period for the coin.
Chaikin Money Flow: CMF was below the zero-line, suggesting a potential bearish phase for XRP.
Klinger Oscillator: KO was above the signal line and indicated a bullish period for the coin.
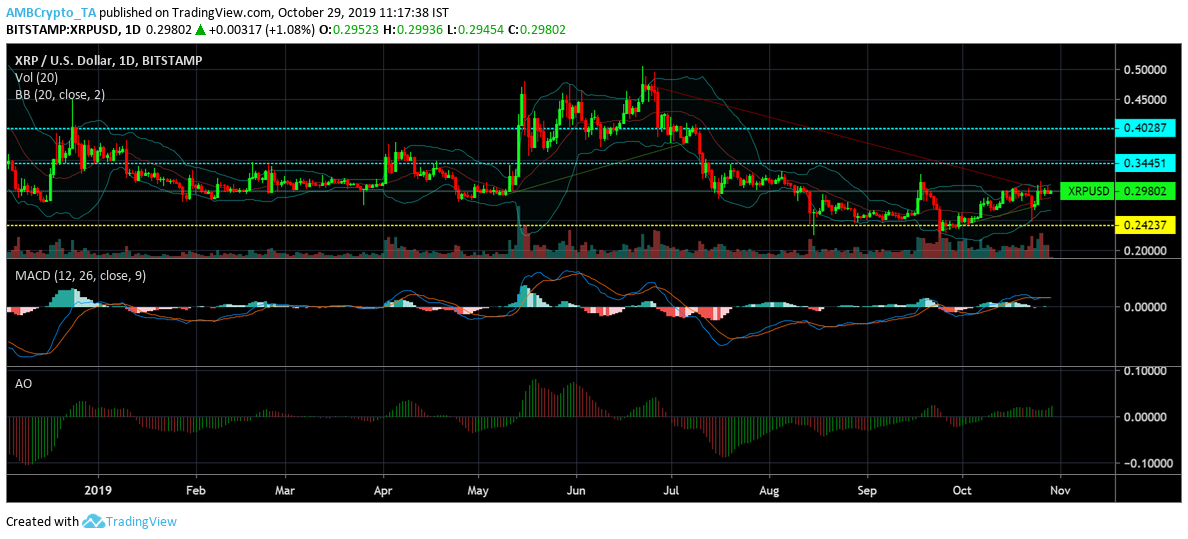
XRP 1-Day Chart:

Source: XRP/USD on TradingView
A major uptrend from $0.29 to $0.37 was registered on XRP’s daily chart. Another minor uptrend from $0.23 to $0.27 was seen. The chart depicted a significant downtrend from $0.47 to $0.30. XRP found major resistance at points $0.34 and $0.40 respectively while the support stood firm at $0.24.
Indicators:
Bollinger Bands: The parallel bands depicted a period of market stability for XRP.
MACD: MACD line was above the signal line following a bullish cross-over and depicted a positive phase for the coin.
Awesome Oscillator: The closing lines of AO were green, this further depicted a bullish phase for the coin in the near-term.
Conclusion:
Overall XRP market signaled for a bullish phase and a period of stability.


