YFI, VeChain, Litecoin Price Analysis: 16 May

YFI’s technicals suggested that the cryptocurrency possessed bullish strength to sustain its rally. VeChain was projected to move sideways within a fixed channel. Lastly, Litecoin traded within $330-$300 – an area that needed to be defended against bearish pressure.
YFI

Source: YFI/USD, TradingView
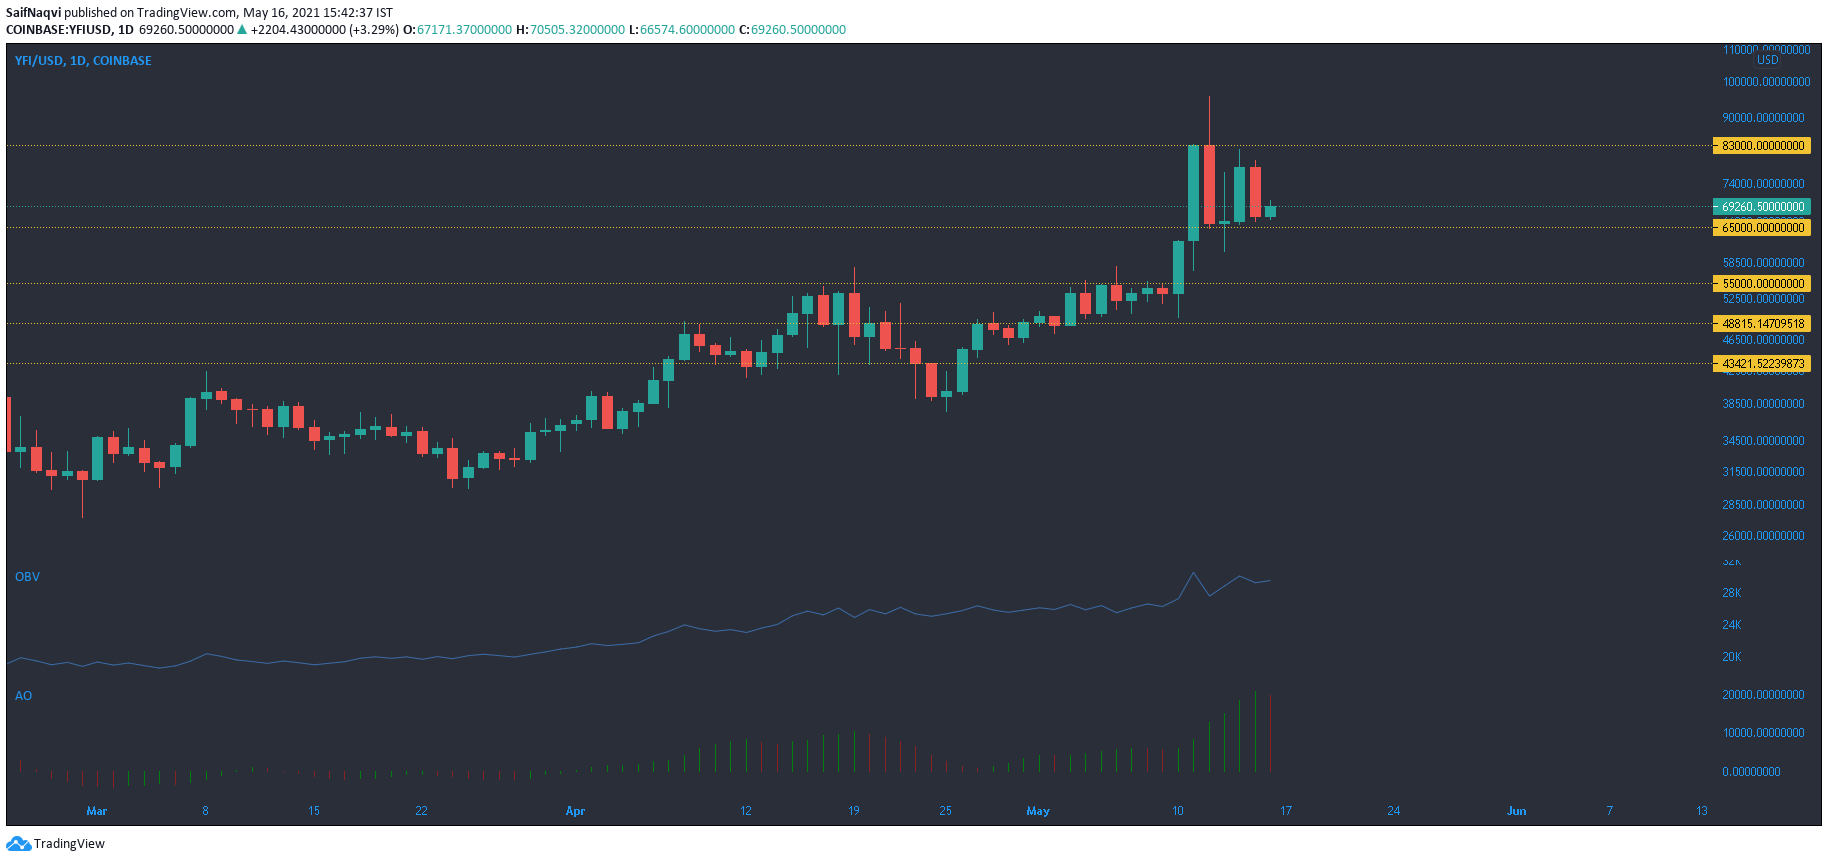
Year-to-date gains of 210% may be modest when compared to some other alts in the market, but a rise above $55,000 indicated bullish progress for YFI- one that could see sharper gains over the coming months. A breakout above $55,000 had already fueled a 50% jump in value to above $83,000, but a broader market pullback complicated matters. Unable to fully take advantage of its rally, YFI noted choppy movement over the past few days.
Healthy volumes and buying pressure have allowed the price to trade above $63,000-65,000 support. OBV’s uptrend attested to buying activity in the market. Awesome Oscillator’s green bars also conformed with OBV’s stance. There was some resistance around $83,000 and a break above this could see another price swing. Conversely, a breakdown could see losses towards $48,000 or $43,000.
VeChain [VET]

Source: VET/USD, TradingView
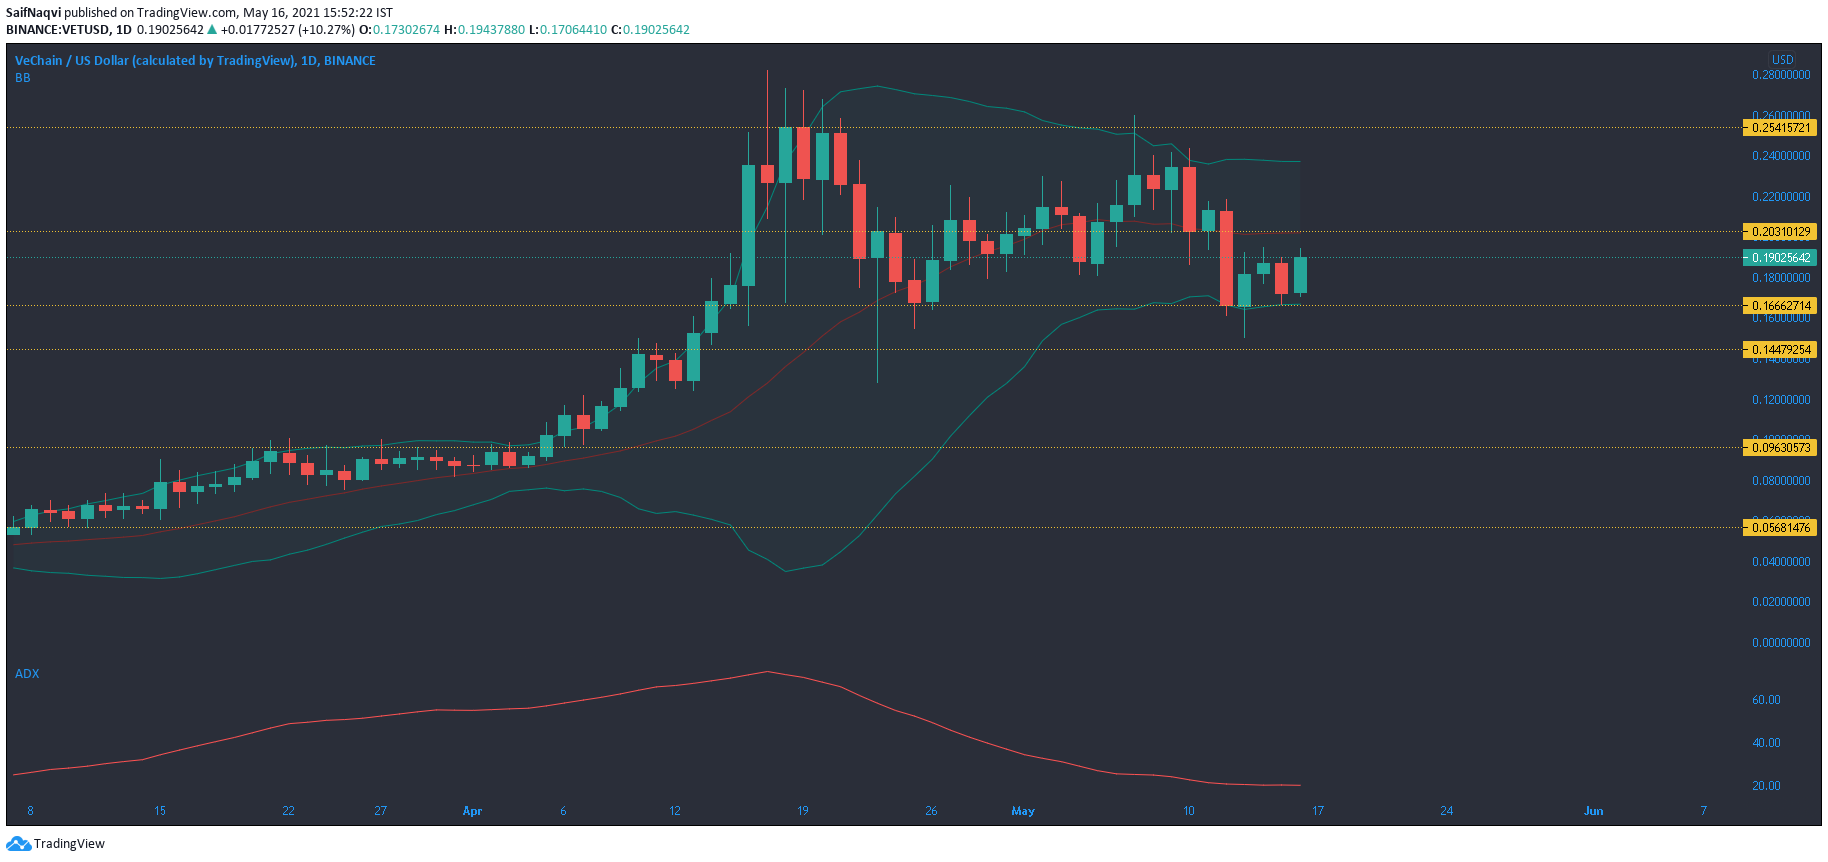
An ADX reading of 20 showed a weak directional market as VeChain traded between $0.203 and $0.1666. Low volatility was also evident from the constricted nature of Bollinger Bands. Considering its technicals, VET would likely continue to see some rangebound movement over the coming days.
A rise above $0.203 could spur some additional buying but gains would likely be capped at $0.254-resistance.Having said that, a breakout from $0.254 could see a shift of market dynamics towards the bullish side and volumes must be observed for such an outcome.
Litecoin [LTC]

Source: LTC/USD, TradingView
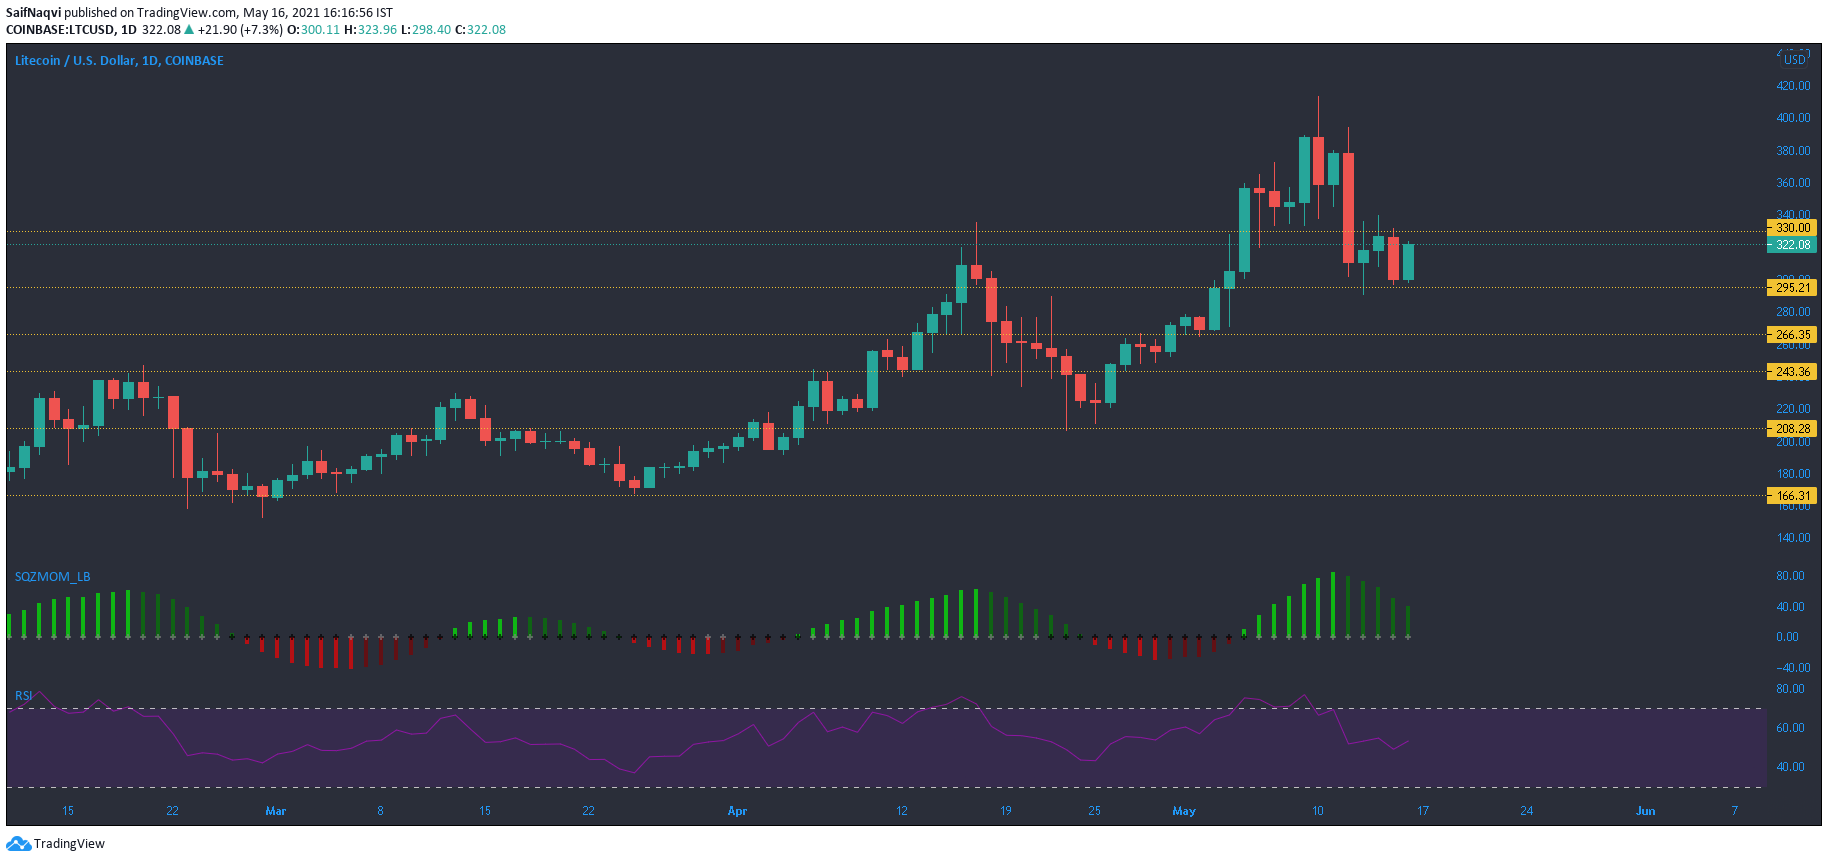
On the daily chart, Litecoin traded within a buy zone of $330-$300. The current area needed to be defended from a sell-off towards the 50-SMA (not shown) around $266. While the 4-hour chart did register a series of bullish candlesticks, bearish sentiment still prevailed on the daily timeframe.
The Squeeze Momentum Indicator highlighted bearish momentum and a dip below half-line would present a sell signal. This would also lead to a breakdown towards the 50-SMA. RSI floated around neutral-50 but did point north at the time of writing. If the present buy area is retained, a comeback above $330 would become a possibility, however, broader market cues would likely dictate LTC’s trajectory.


