Ethereum, Ethereum Classic, Bitcoin Cash Price Analysis: 16 May

Ethereum could see a round of consolidation before the next swing above $4,000. Ethereum Classic moved within a bullish falling wedge pattern. Bitcoin Cash could see an extended sell-off in case of a break below $1,160.
Ethereum [ETH]
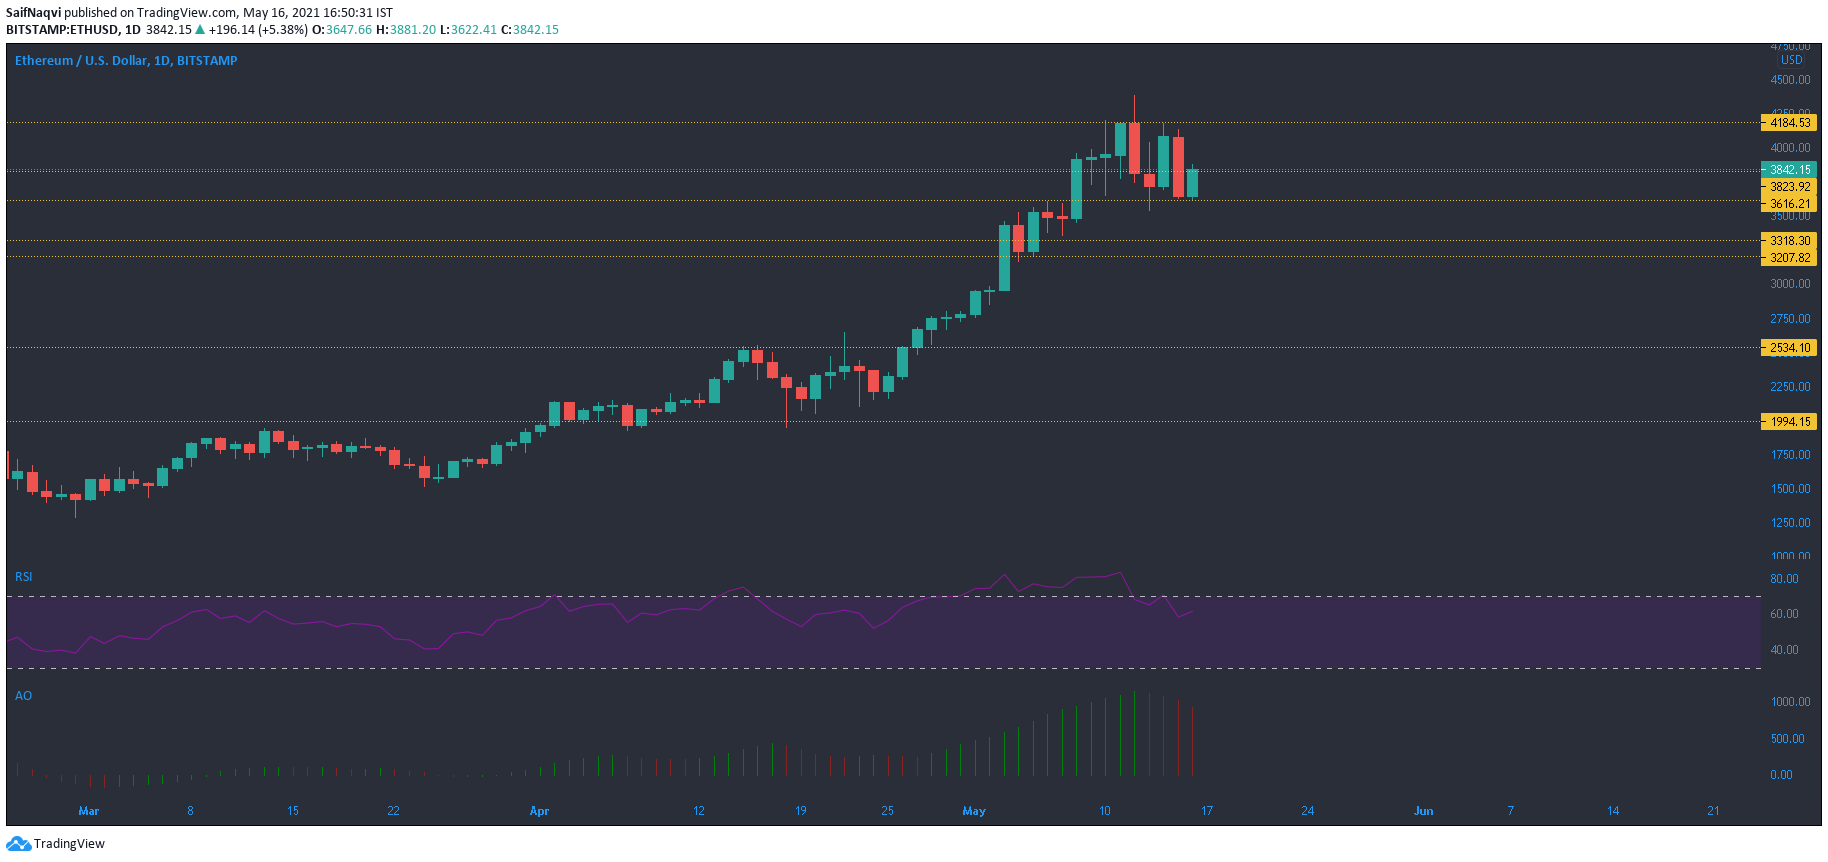
After snapping an ATH above $4,000, Ethereum lost steam and saw dips over the past few days. However, a strong support area between $3,570 and $3,645 was made prominent during this process. According to Awesome Oscillator, the wave of selling pressure was yet to be dissipated and ETH could see some more consolidation before the next swing.
RSI highlighted overbought conditions and moved below 70 but maintained bullish territory at the time of writing. With healthy volumes and buying pressure still a driving force in the market, a breakdown was unlikely.
Ethereum Classic [ETC]
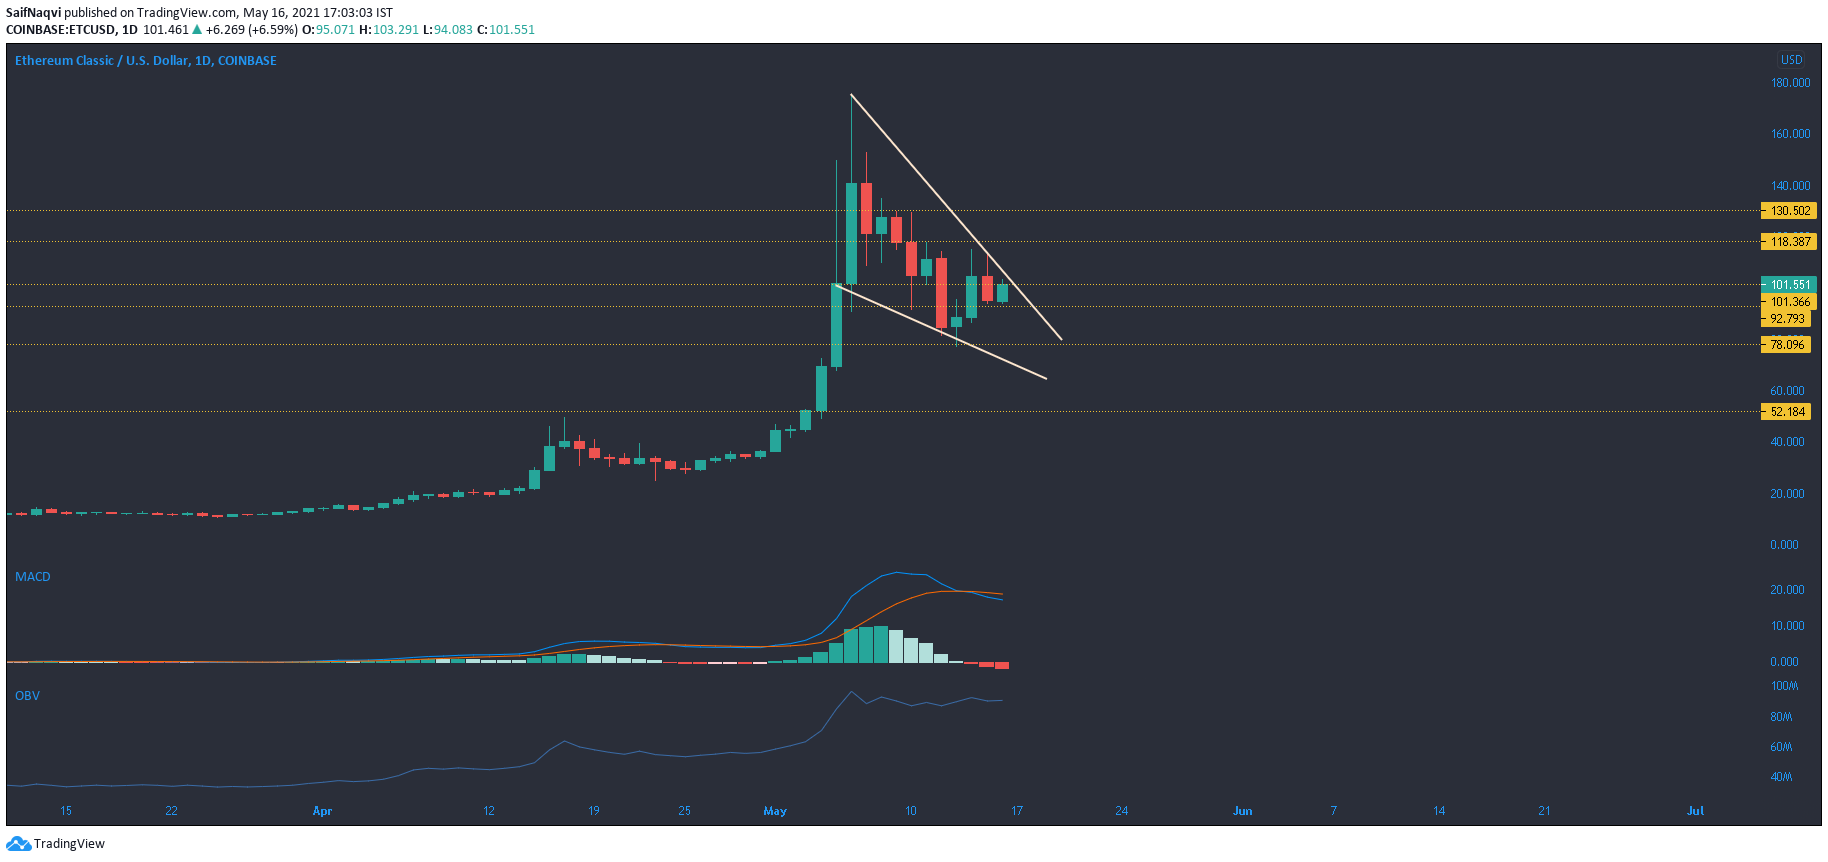
Ethereum Classic’s most recent rally suggested that it got the most mileage out of ETH’s bull run above $4,000. However, with ETH now shifting to a consolidation stance, gains were limited in ETC’s market as well. Lower highs and lower lows were observed on the daily timeframe as the crypto-asset traded within a falling wedge pattern. On the plus side, this wedge represented a bullish pattern- one that generally sees a break to the upside.
Support levels at $78.1 or $52.2 could trigger buying and enable a breakout opportunity but the outcome would largely depend on broader market cues. A favorable outcome would see ETC head back towards $120 or even $130.5. MACD line moved below the Signal line and outlined bearish conditions in the market. OBV’s flat-like movement showed that buying pressure equaled selling pressure over the last couple of days.
Bitcoin Cash [BCH]
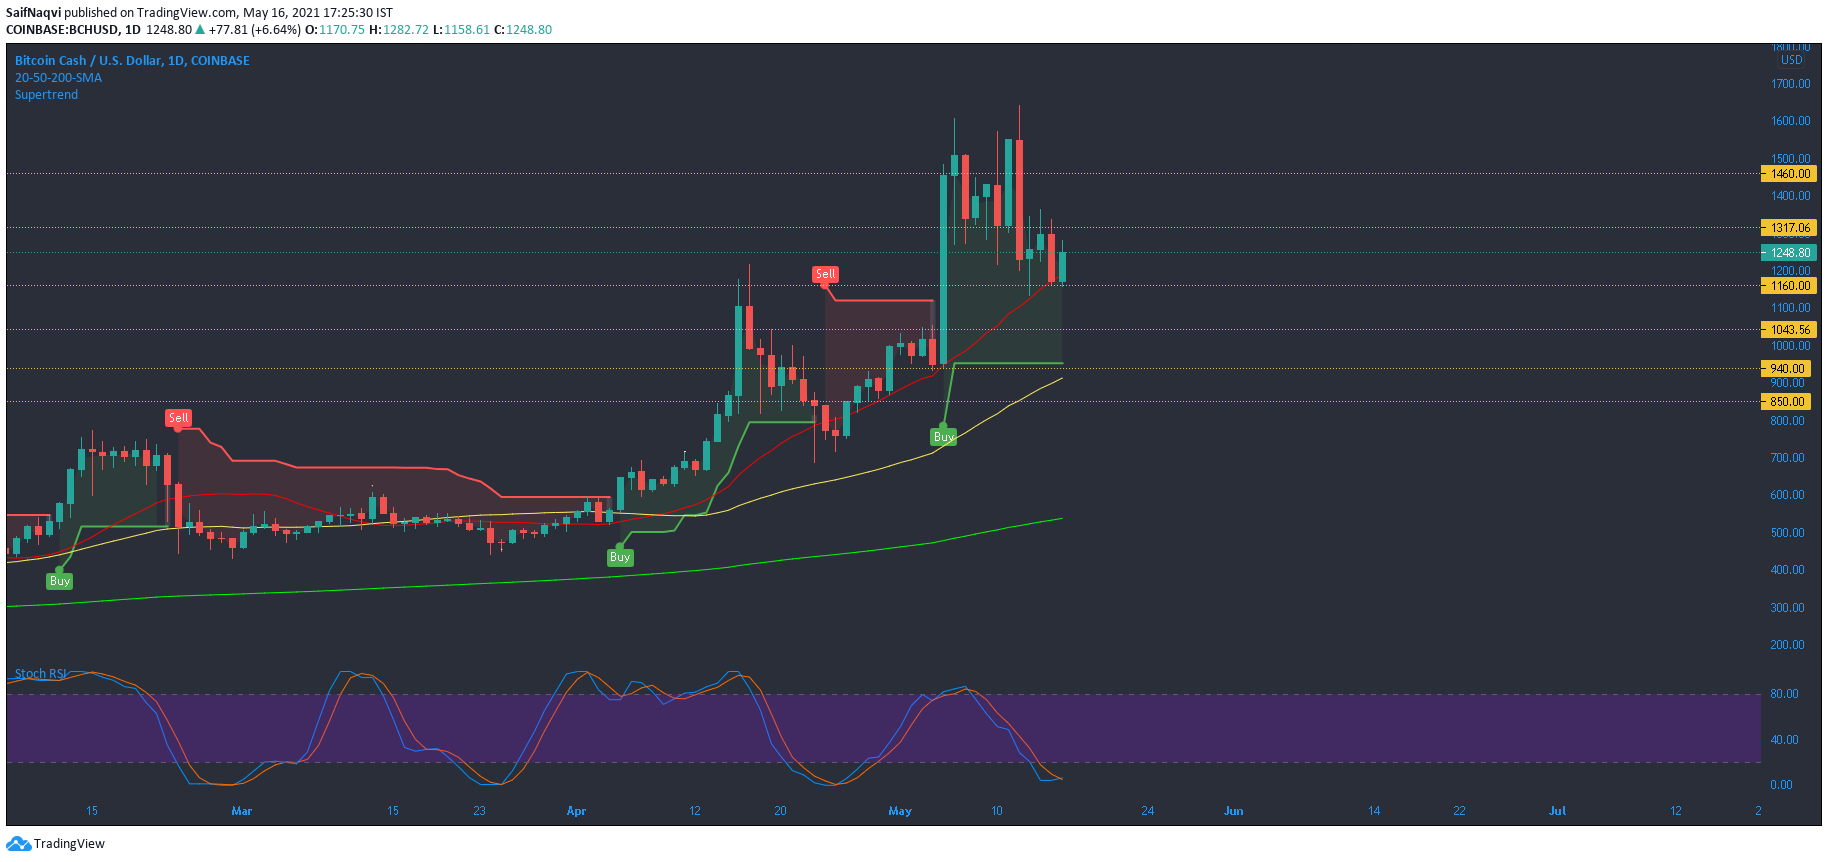
While a previous analysis mentioned $1,200 as the cut-off point for the bulls, the daily timeframe highlighted a steady support area at $1,160. However, a dip below this region and the 20-SMA could spell some danger for Bitcoin Cash’s short-mid term trajectory. Another round of sell-off would present support marks at $940 and $850.
SuperTrend Indicator flashed a buy signal at the current price point and placed a stop-loss around $940 and the 50-SMA (yellow). Stochastic RSI showed a bullish crossover in the oversold zone and BCH could maintain above $1,160 moving forward.


