Zcash retests $56 as resistance; these Fib levels can serve as support

Disclaimer: The information presented does not constitute financial, investment, trading, or other types of advice and is solely the opinion of the writer.
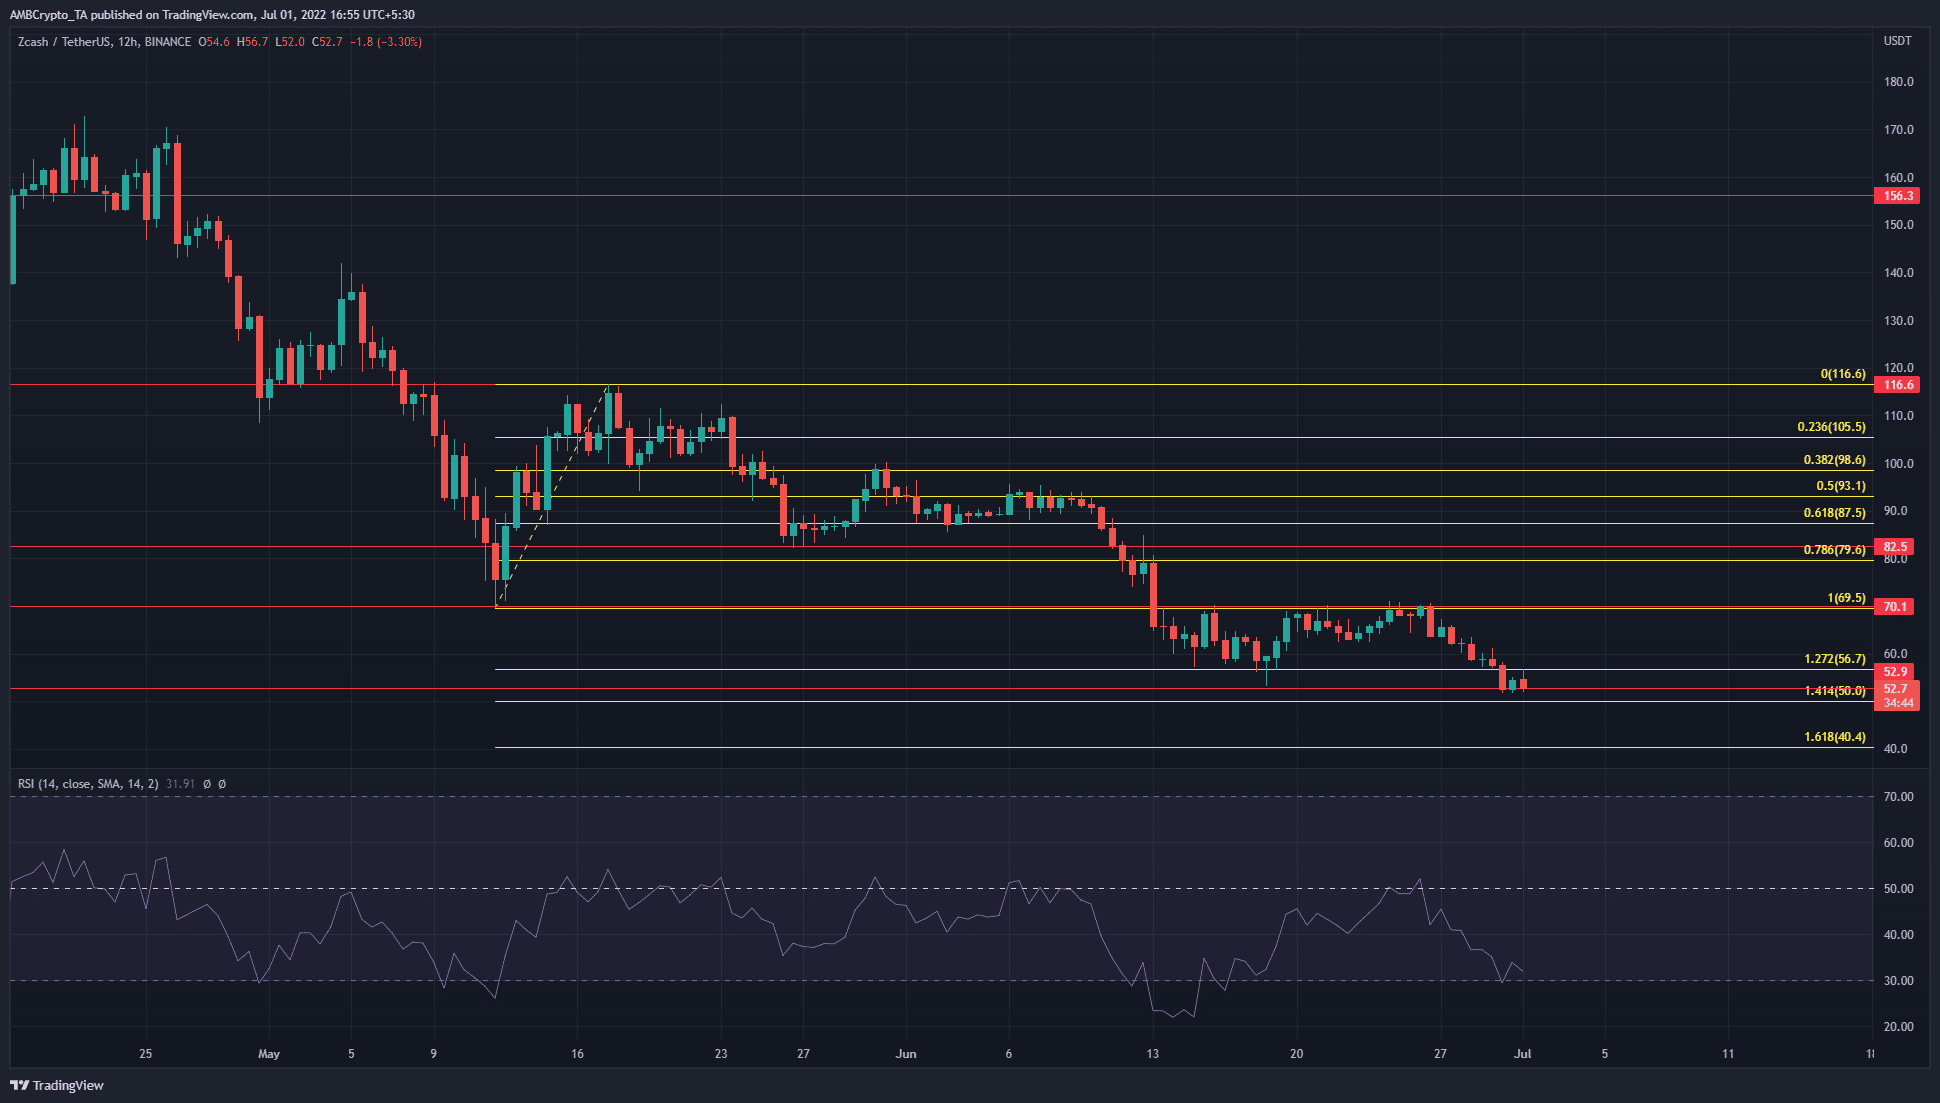
Since early April, Zcash has been on a steady downtrend. It formed a peak at $210 in late March, but its higher timeframe market structure has been bearish since mid-April. At that time, the price fell below the $160 area, which had formerly been a support level. The price retested the same region as resistance later in April. It proceeded to set a series of lower highs on the charts, a trend that continued to the time of writing.
ZEC- 12-Hour Chart
The downtrend has been interspersed with periods of rapid rallies. One such occurred in mid-May when ZEC bounced from $69.5 to $116.6. In the following weeks, the price slowly bled and slid lower down the charts to trade at $52.7 at the time of writing.
Earlier this month, the area from $53-$57 was tested as a demand zone and saw a bounce to the $70 level. However, bears came out on top once again and forced the price back below the $60 mark.
The Relative Strength Index (RSI) confirmed a downtrend to be in progress in recent weeks. It was unable to cross the neutral 50 line and indicated strong downward momentum on the 12-hour chart.
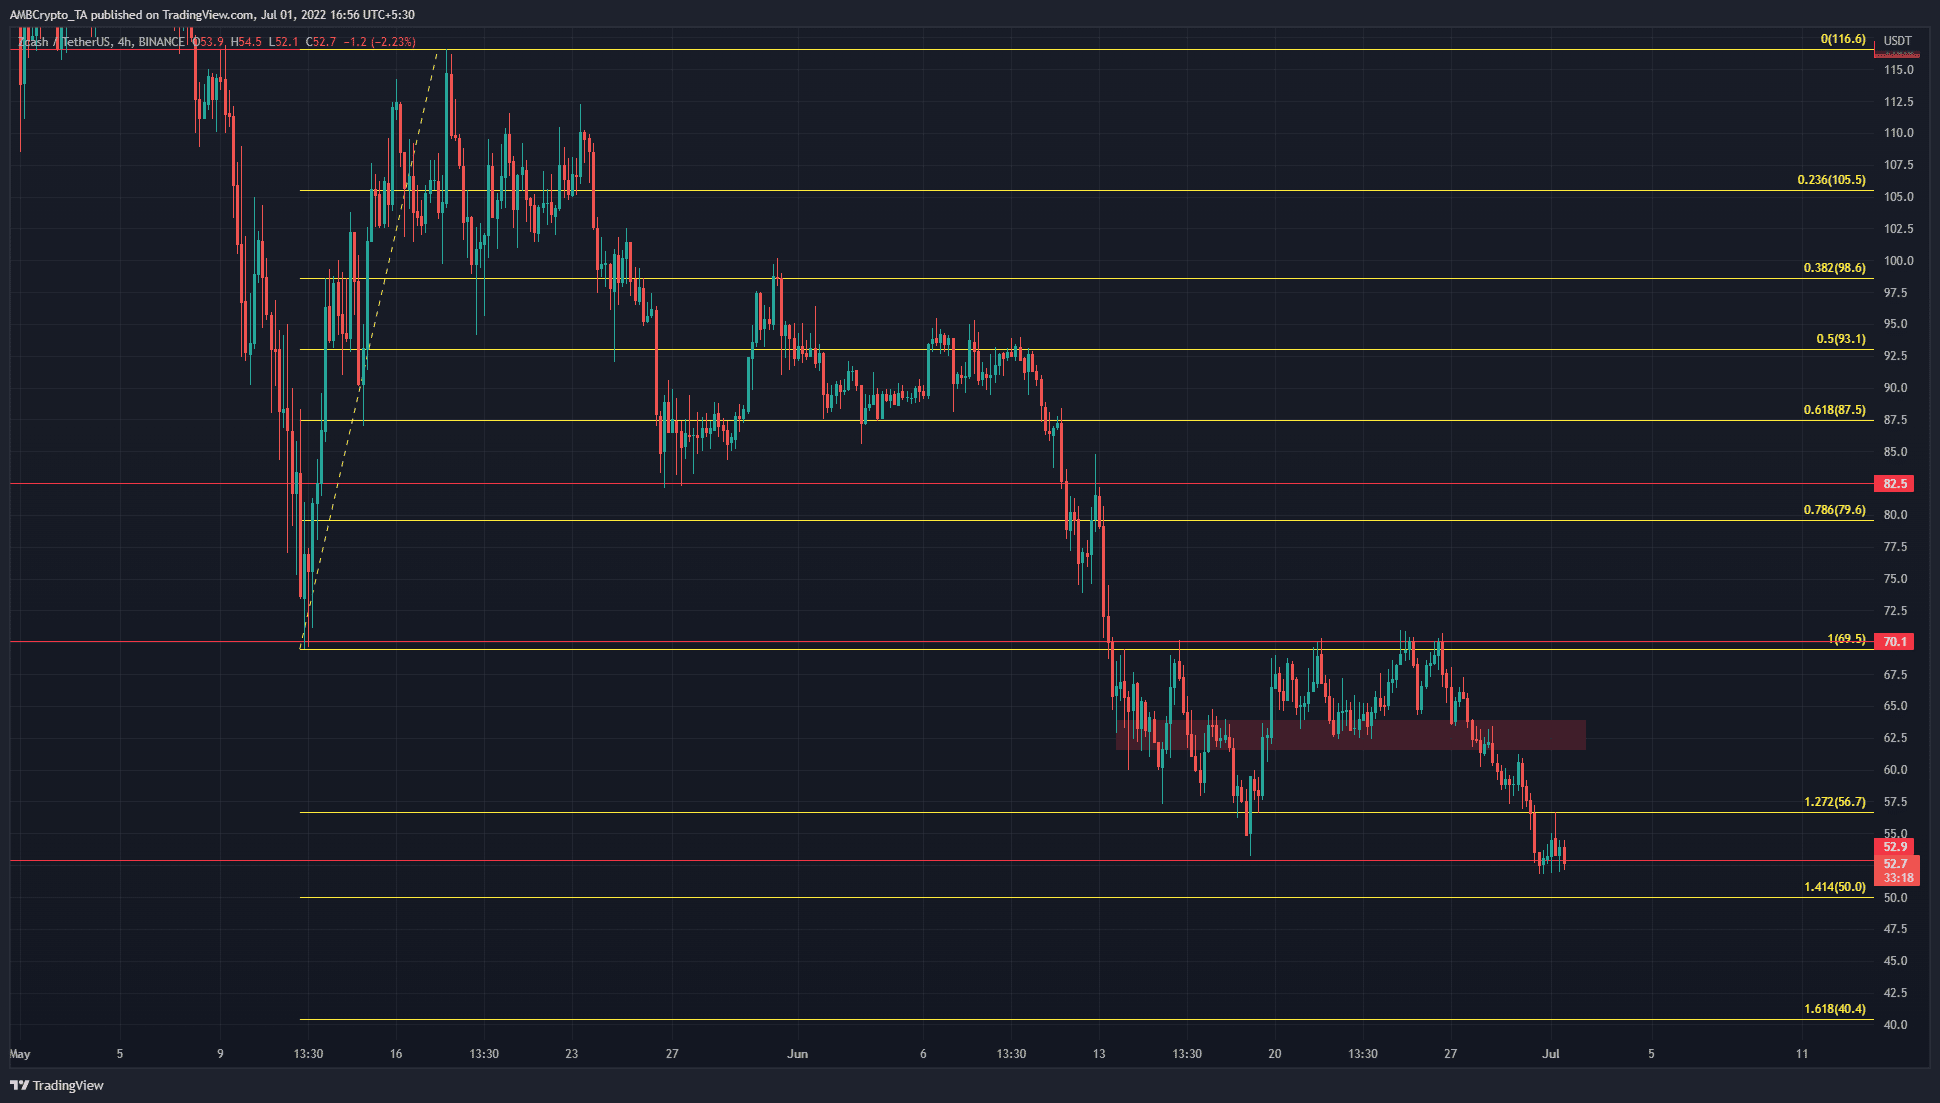
ZEC- 4-Hour Chart
The aforementioned bounce from $69.5 to $116 was used to plot a set of Fibonacci retracement levels. ZEC has broken beneath each one of them, and in the past two weeks, has also retested $70 as resistance. In the past few days of trading, both the $70 and the $62.5 area were shown to be stiff resistance zones.
Furthermore, buyers were unable to drive prices any higher. When Bitcoin [BTC] slipped back below $20k, ZEC also lost a hefty chunk of value and dropped from $60 to $52.7.
$52.9 was then a support level, and further southward, $50 and $40.4 were plotted as the next Fibonacci extension levels to watch out for. Since $50 was a psychological support level as well, it could halt the bearish pressure for a few days.
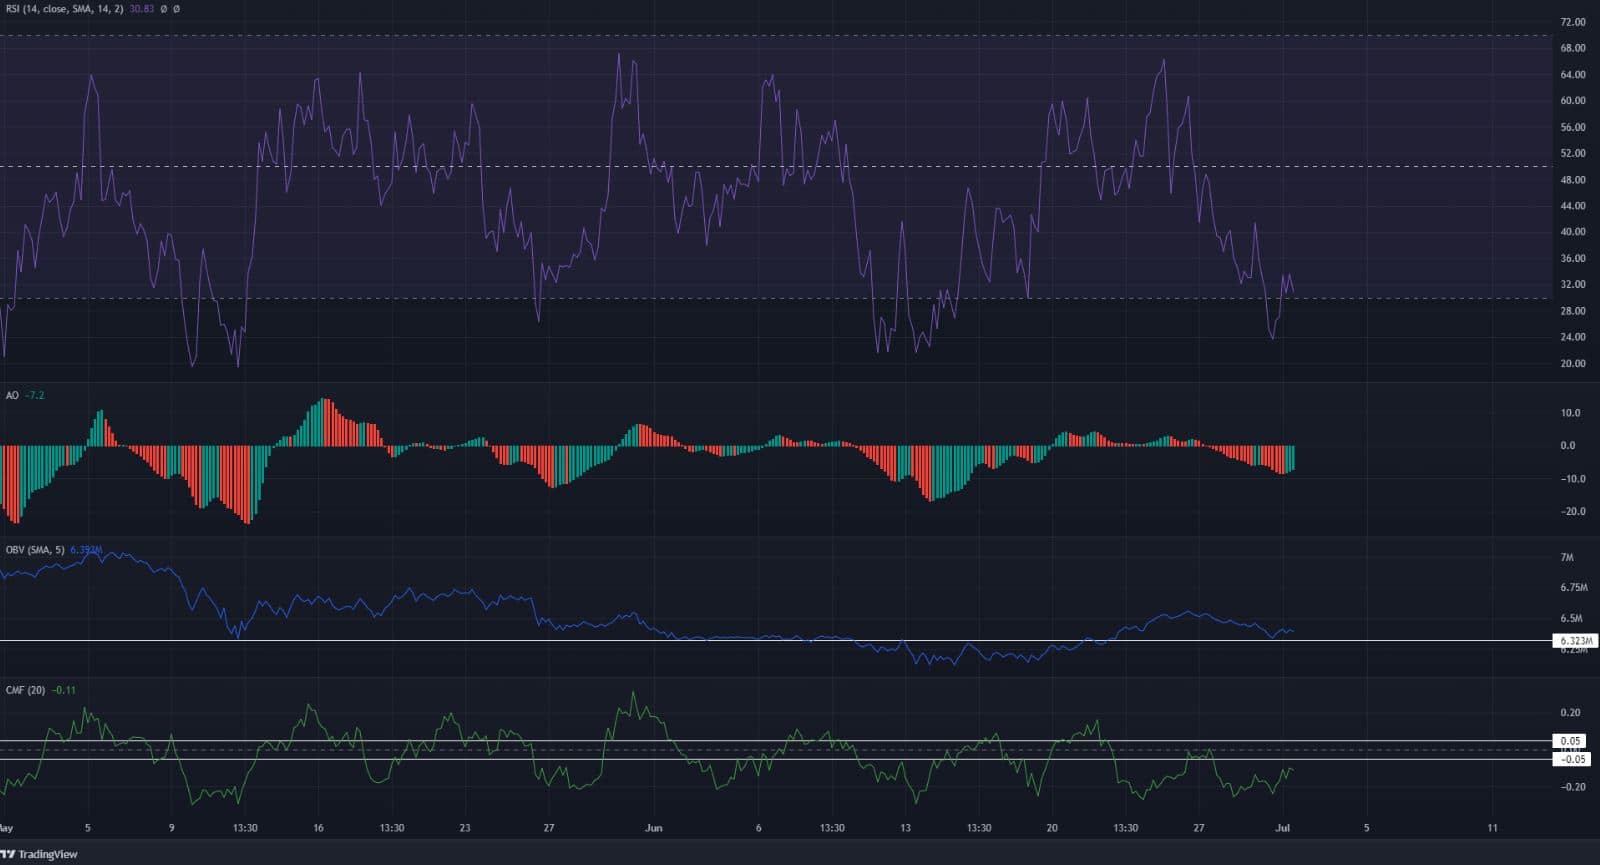
The four-hour indicators also painted a bearish picture for ZEC. The RSI was well beneath the neutral 50 line. The Awesome Oscillator (AO) also dropped sharply beneath the zero line in recent days. Both these developments highlighted the intense bearish momentum.
The Chaikin Money Flow (CMF) was also beneath the -0.05 mark, to show significant capital flow out of the market. However, the On-Balance Volume (OBV) continued to hold onto a support level from May.
Conclusion
If the OBV dipped beneath the support, and ZEC also dropped beneath the $50 mark, it could be a sign that further losses were likely for Zcash. $40.4 was highlighted as a Fibonacci extension level where a bounce could occur. $44 was also a spot to watch out for. If Bitcoin also saw a move below $18.8k, the drop could be hastened for Zcash.


