4 reasons why Bitcoin’s price went down

Bitcoin has surged a whopping 100% in the last 30 days, however, the recent crash might indicate that the top is in, or at least an interim top. While the investors were FOMO-ing, bitcoin’s on-chain indicators flashed sell-signals.
Miner effect
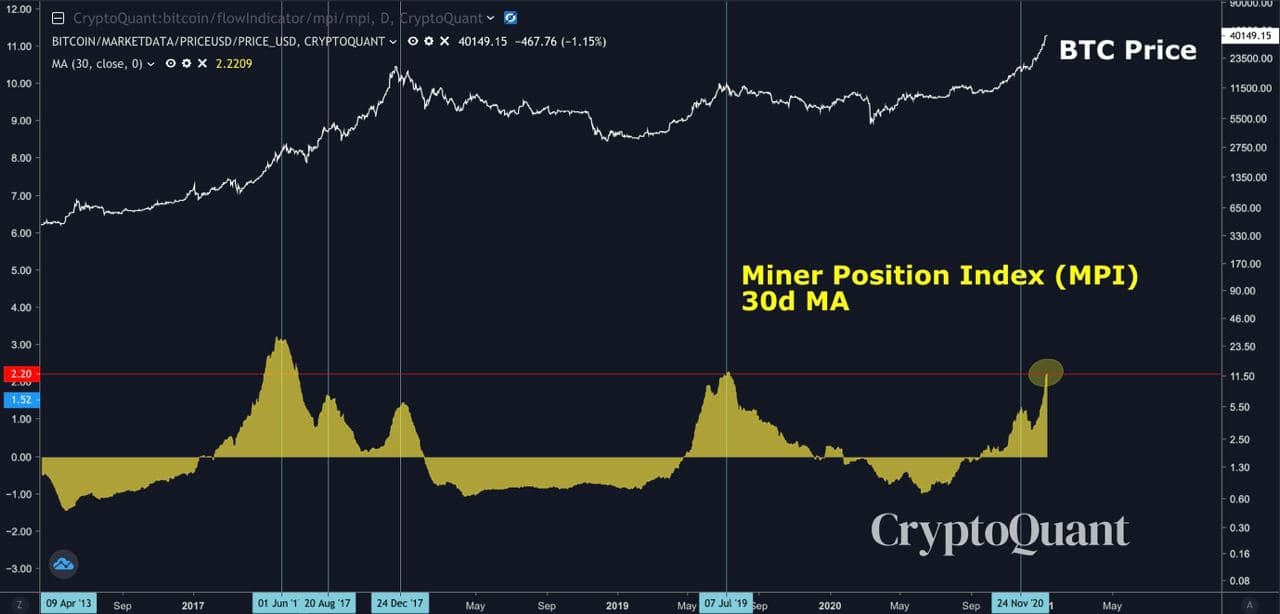
The main reason why this crash took place is due to bitcoin miners. In fact, bitcoin’s recent surge, in part, is to be credited to the miners, since they stopped selling their bitcoins during the rally.
As seen in the image, the Miners Position Index hit 2019 highs and indicated that the miners started selling. Moreover, the 1st spend chart from ByteTree shows that $47 million worth of BTC was seen flowing out of miners’ wallets and into exchanges reconfirming the recent drop.
Bitcoin’s price has dropped 20% in the last 20 hours as a retracement to the parabolic run seen in the last 2, 3 months.

BTCUSD TradingView
The next support levels that could cushion the drop include $34,000 and $32,700.
Other on-chain indicators
Other on-chain indicators predicted a potential crash long before the actual crash happened.

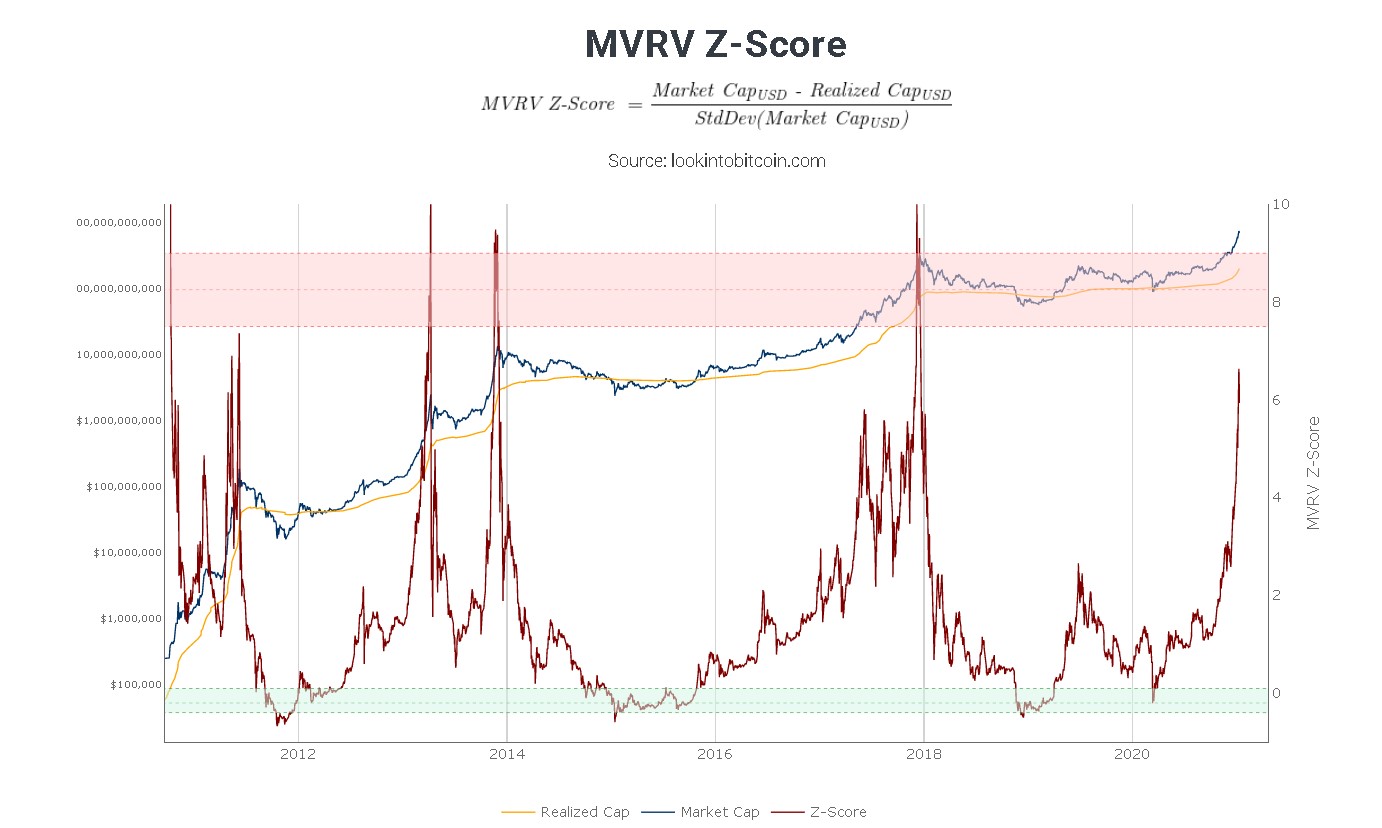
Source: Lookintobitcoin
MVRV Z-score
MVRV Z-score is an indicator that considers bitcoin’s realized market cap, the actual market cap, and calculates its standard deviation to identify cycle tops and is a derivation of the MVRV metric.
At press time, MVRV is at a level last seen in 2017, hinting that the recent parabolic run up might face a correction. As of January 10, bitcoin did just that and is down 11% at the time of writing.

Source: Twitter
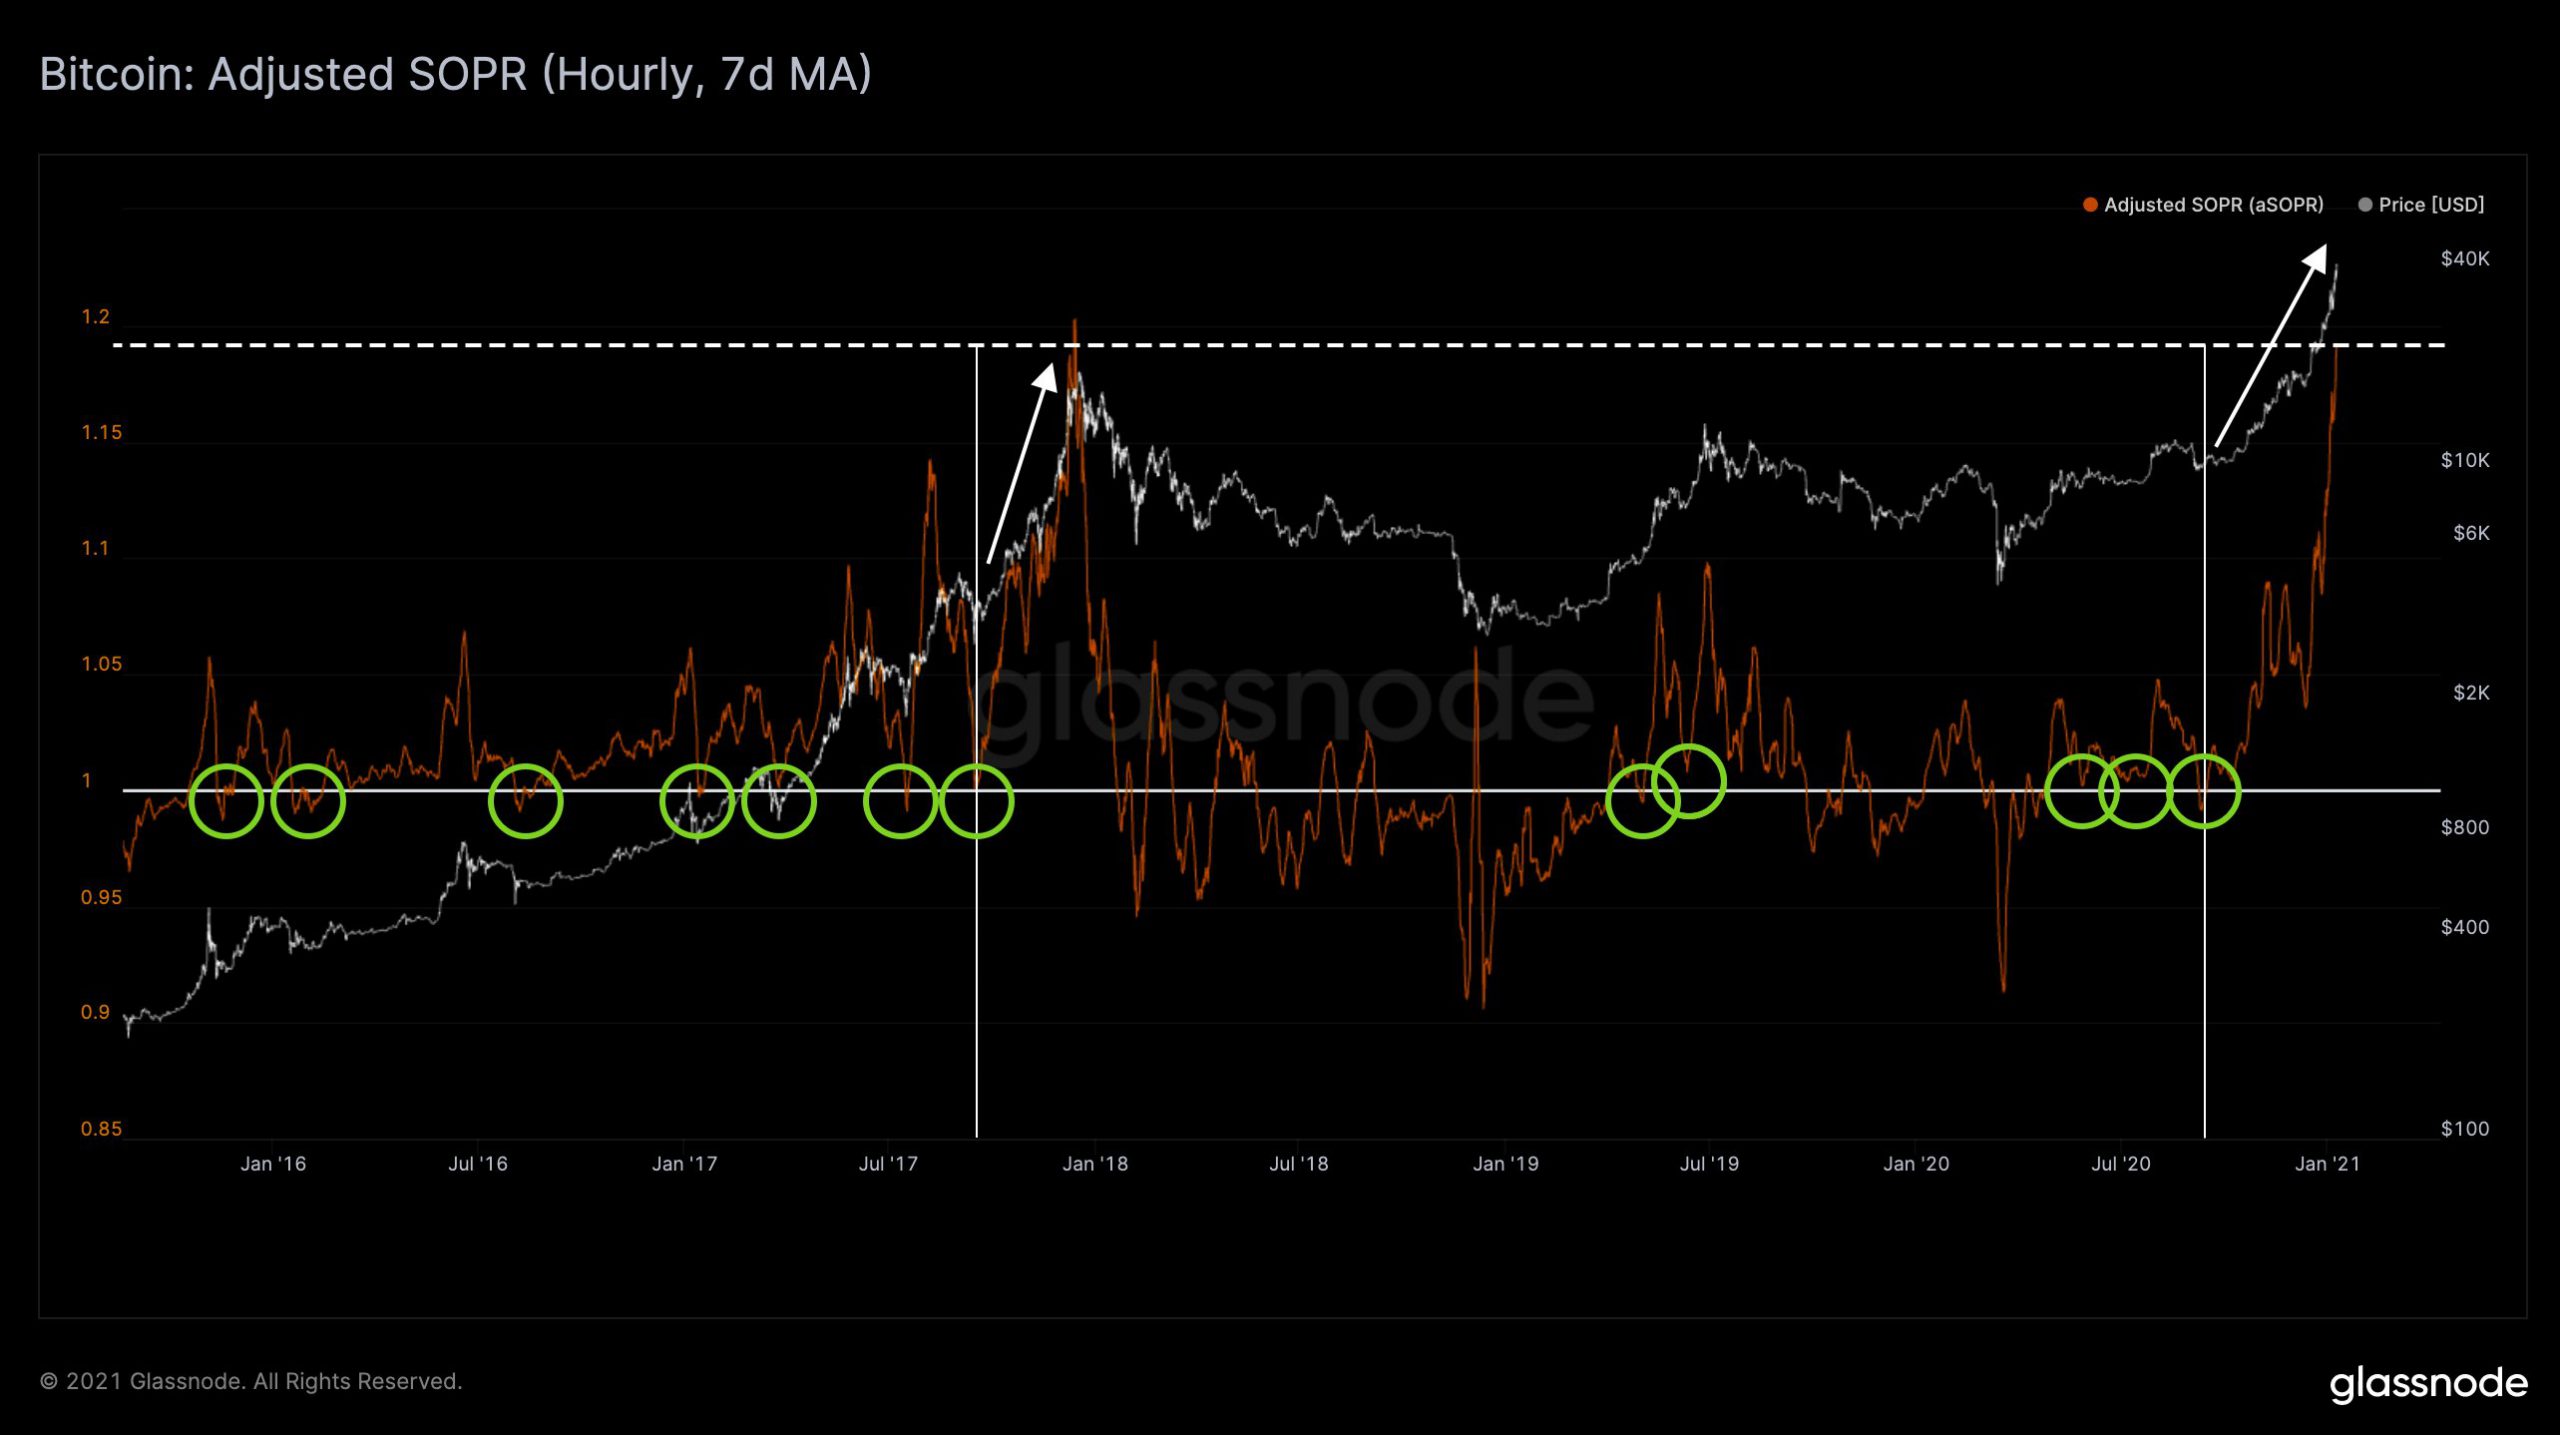
SOPR indicator and aSOPR
SOPR indicator is an indicator used to determine whether the investors holding bitcoins are in profit or at a loss. The indicator calculates this by considering the price at which bitcoin last moved and compares it to the current price of bitcoin. If SOPR is high, then investors are in profit, indicating that they might be inclined to sell and cash in the profits. Adjusted SOPR or aSOPR is a metric that is derived but it does not include bitcoins moved in the last hour. As seen in the chart, the aSOPR was continuously surging for over 3 months.
A reset would have indicated that the rally was healthy. The 2017 bull run also saw a similar surge in aSOPR, which was followed up by a steep correction into the bear market.

Source: Twitter
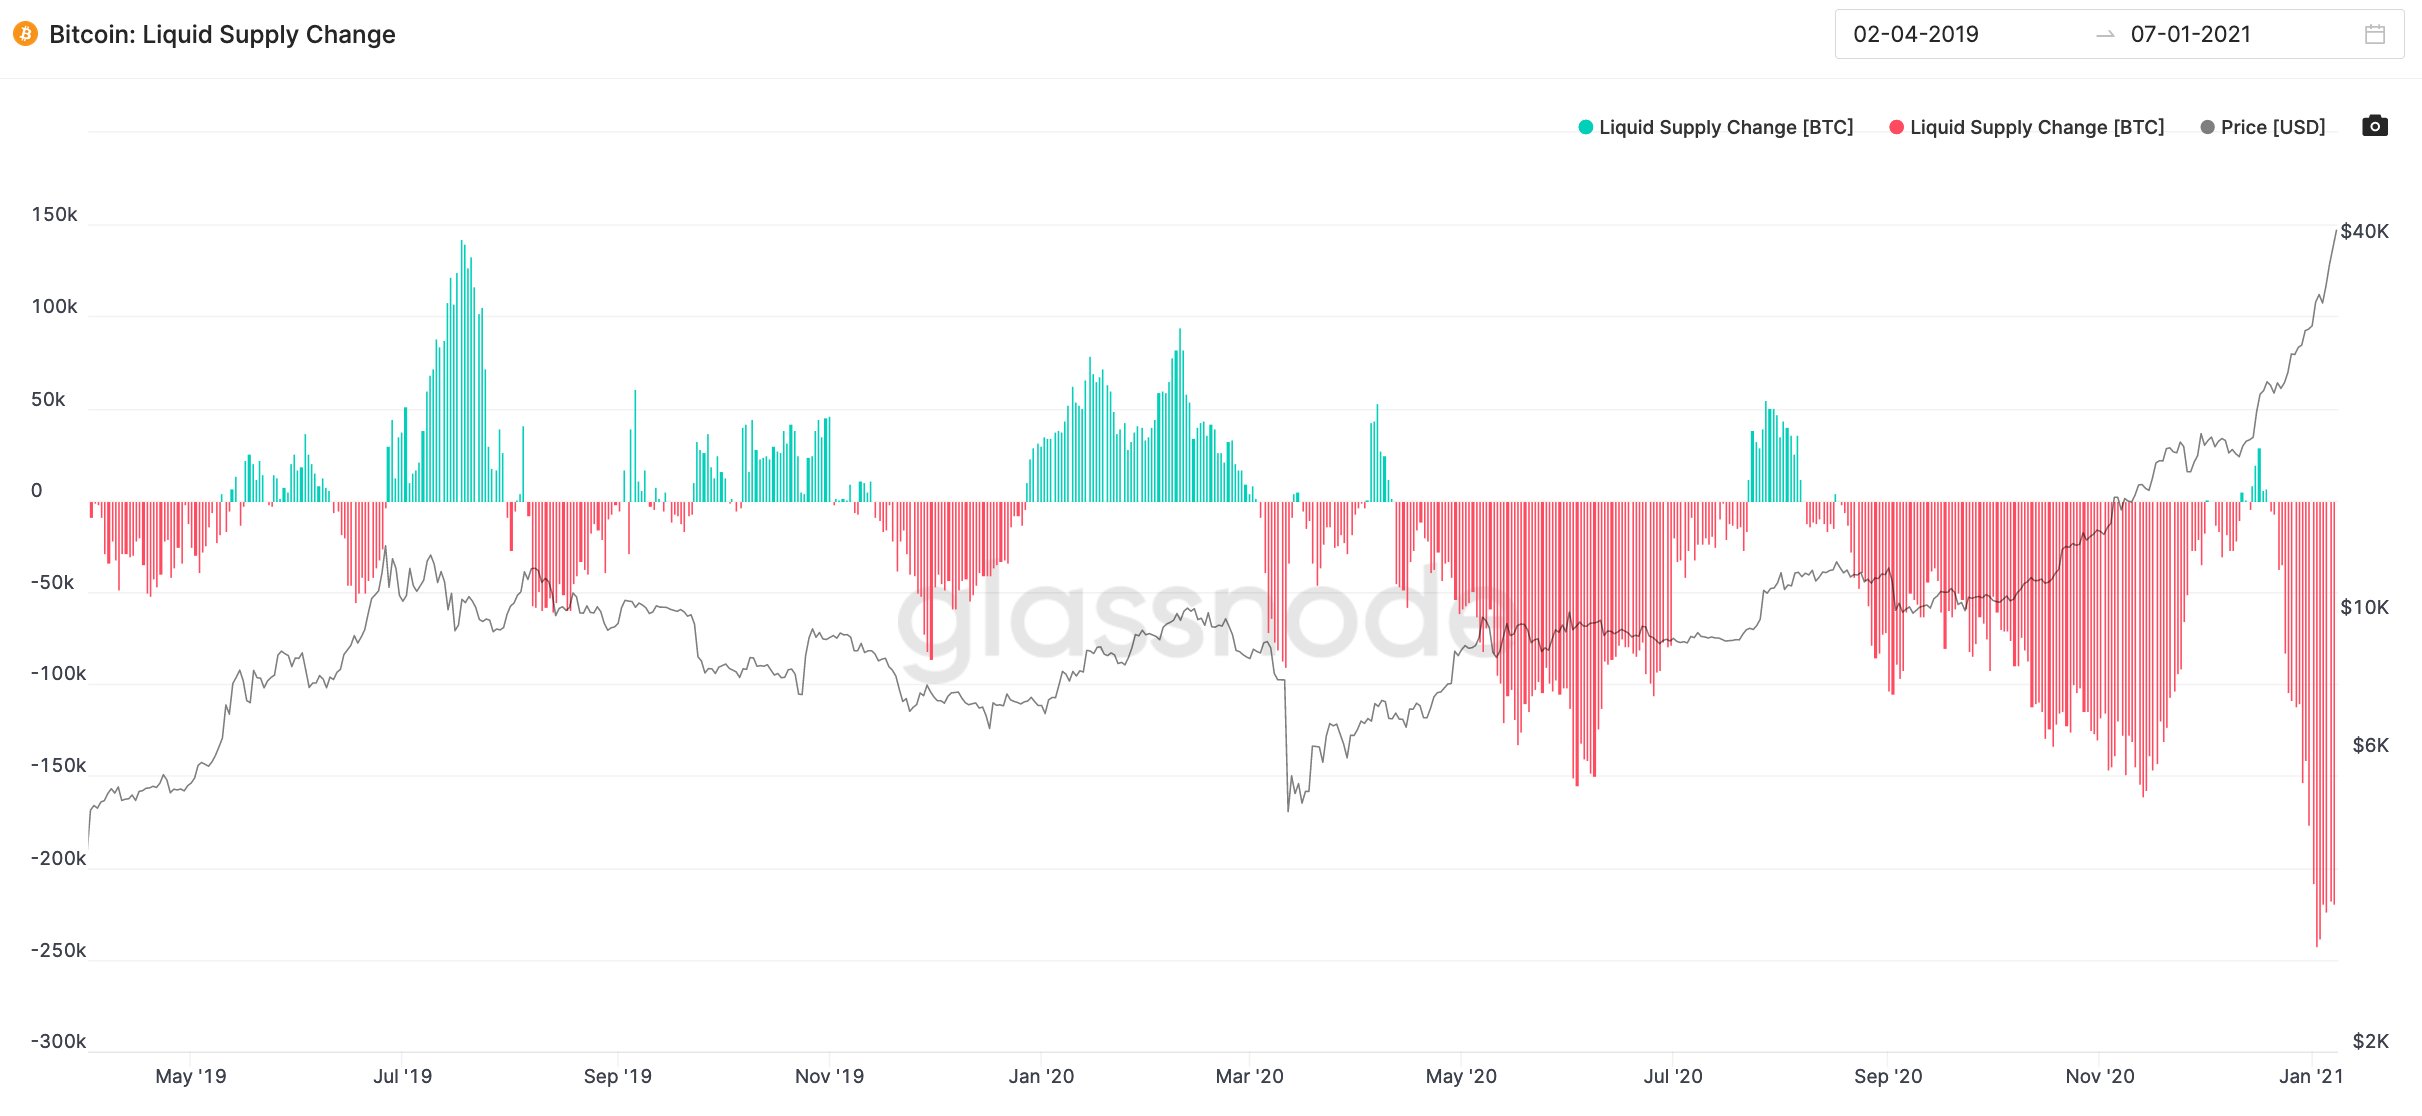
Interestingly, Bitcoin Liquid Supply shows that a lot of bitcoins have moved into the long term hodler wallets, leading to a spike in the red bands. Historically, this transfer of wealth and the spike in red bans are often followed by green spikes, which indicate a correction.


