Stellar Lumens, Maker, FTX Token Price Analysis: 11 January

XLM was guarded by the bulls from falling below $0.243 and a potential reversal could take prices back above the $0.281 mark. On the other hand, both MKR and FTT fell from record highs but their immediate support levels managed to prevent a move lower on the charts.
Stellar Lumens [XLM]
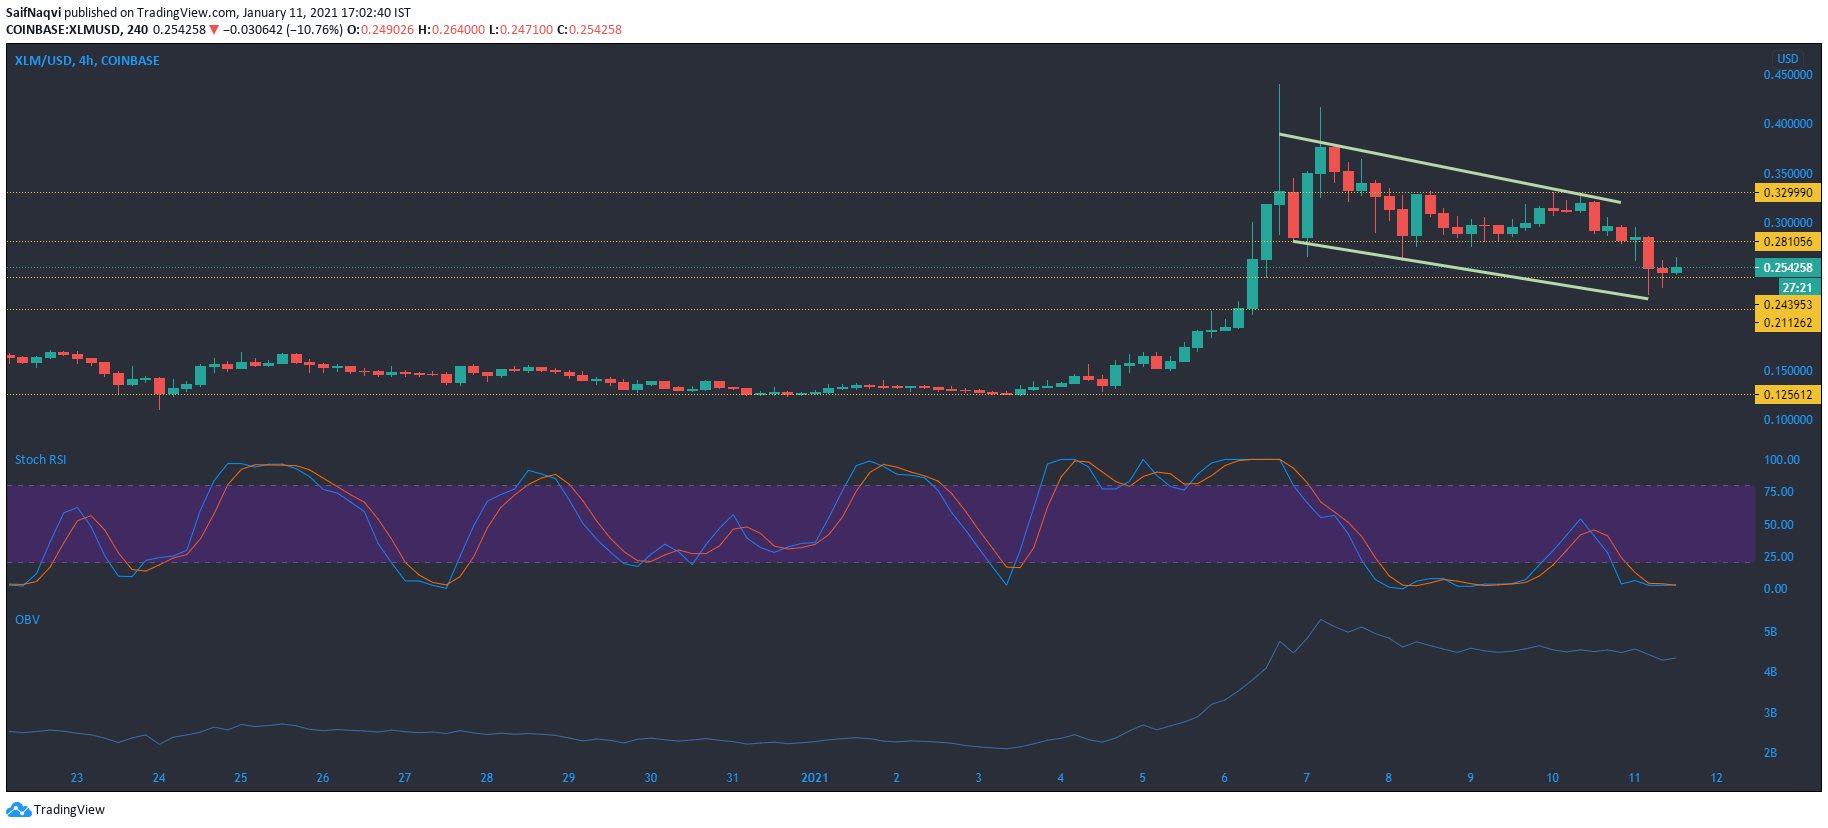
Stellar Lumens, the world’s eleventh largest cryptocurrency by market cap plunged by nearly 22% over the past 24 hours, along with the broader market. A look at the 4hr chart showed that ever since the breakout above the $0.281 level, prices seem to be in a downtrend, hitting lower highs and lower lows. Currently, sellers attempted to take prices below $0.243 support but the bulls managed to shield prices from falling lower. In the short term, indicators suggested that the bulls could take control of the prices.
Since the Stochastic RSI traded in the oversold region, a bullish bounceback could be on the cards and prices could head above their immediate resistance at $0.281.
The On Balance Volume remained in the higher territory and suggested that there were a good number of buyers in the market to support a northbound move for XLM.
Maker [MKR]
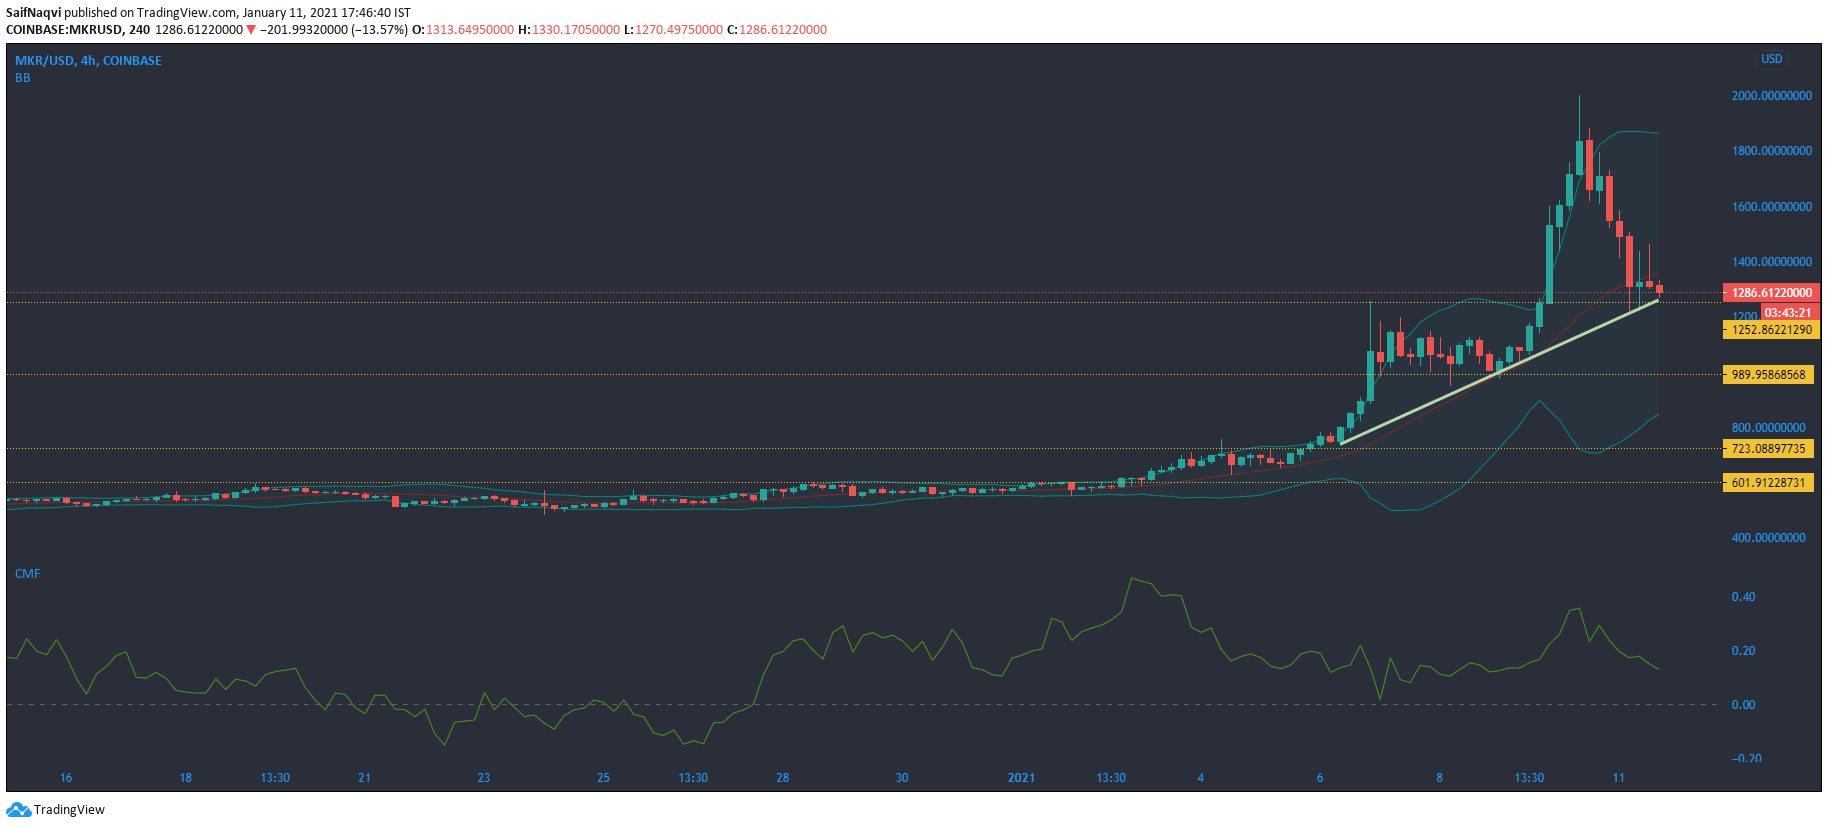
After scaling to record levels at $1999 just yesterday, a broader market correction saw Maker drop towards $1252.8 support. Prices were kept steady at their current support as buyers stepped in to alleviate some selling pressure.
The Bollinger Bands showed a high degree of volatility in prices as the bands were diverging on the charts. Although prices traded on the upper bands and fell lower, a reversal towards the lower band is not a certainty and prices could continue to trade between the upper band and the signal line moving forward. In case prices fall sharply towards the lower band, support at $989.95 could be tested.
The Chaikin Money Flow remained above the equilibrium mark and indicated that capital inflows could prevent a fall below the immediate support in the near future if the index rises once again.
FTX Token [FTT]
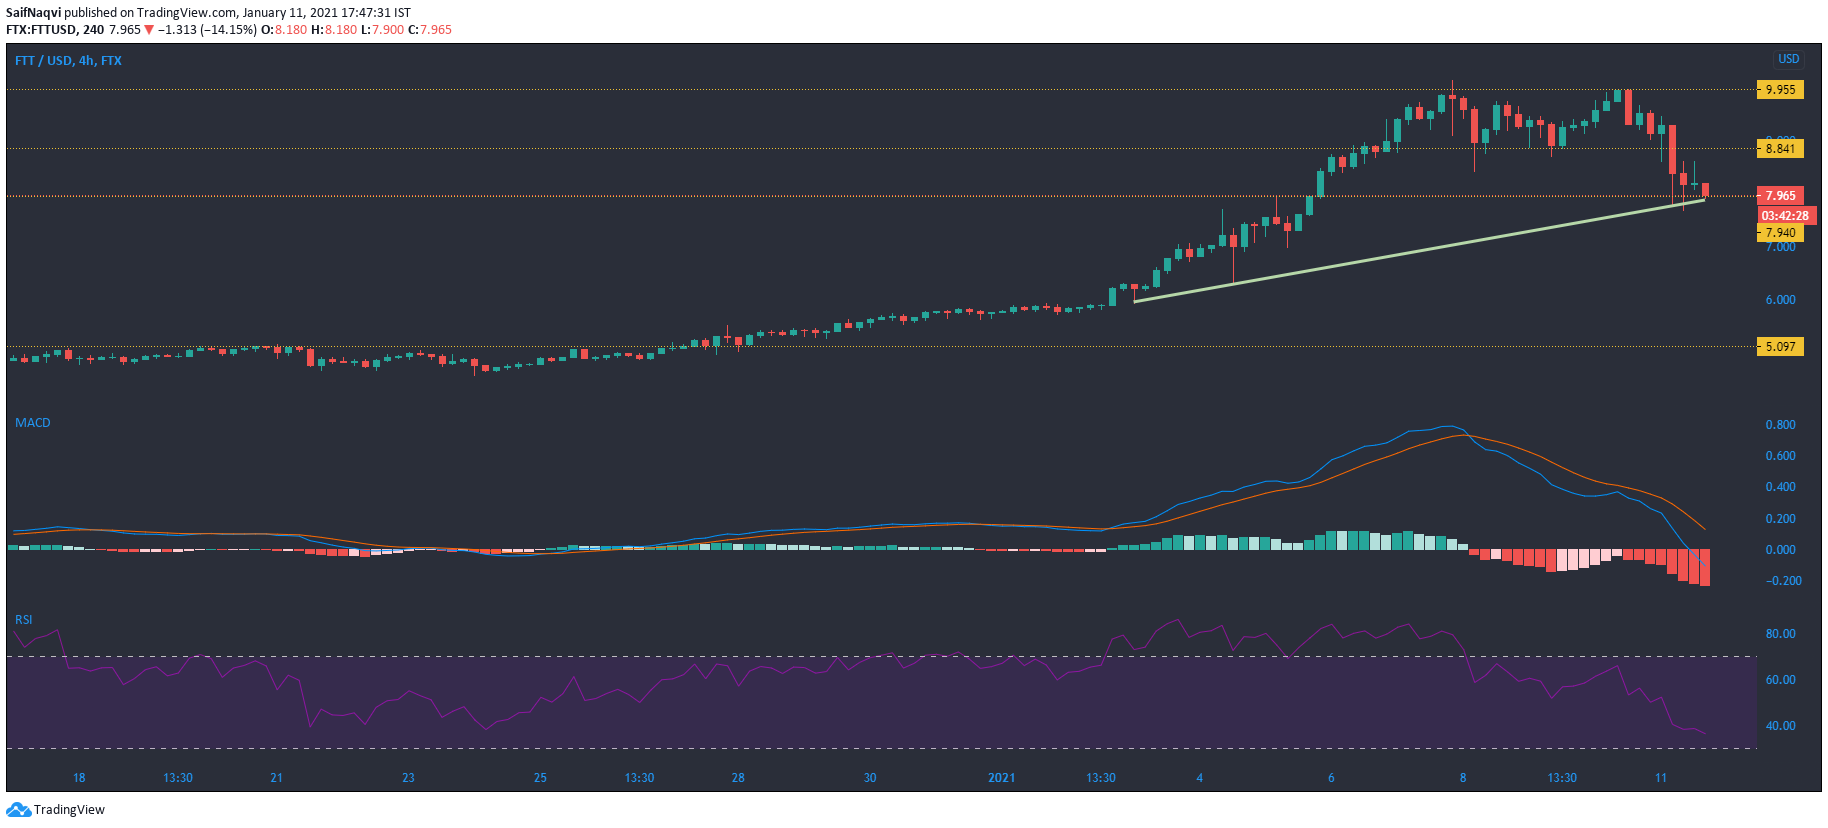
FTT also fell from its all-time high at $10.1 and headed towards support at $7.9. At the time of writing, FTT was trading at $8.36, down by over 17% in the past 24 hours. For now, buyers were holding prices above their current support level, but the indicators suggested that sellers could drag prices lower in the short term.
The Relative Strength Index was moving towards the oversold region. This suggested that the barrier at $7.9 could fail to hold prices moving forward.
The MACD seemed to agree with the RSI and showed that bearishness was on the rise as the red bars on the histogram increased below the zero mark. A bullish crossover was also nowhere in sight as the signal line was moving comfortably above the fast-moving line.


