Bitcoin continues its path on the neutral side as Bulls and Bears reach an impasse

Bitcoin’s price was under significant volatility at the moment. At press time, Bitcoin was priced at $10,704.01 and the largest virtual asset indicated a growth of 5.24 percent over the last 24-hours. The market cap volume remained under the $200 billion dollar mark in the charts, recording $191.44 billion at the time of writing.
The trade volume over the past 24 hours was about $15 billion and the coin was traded most on the BitForex exchange.
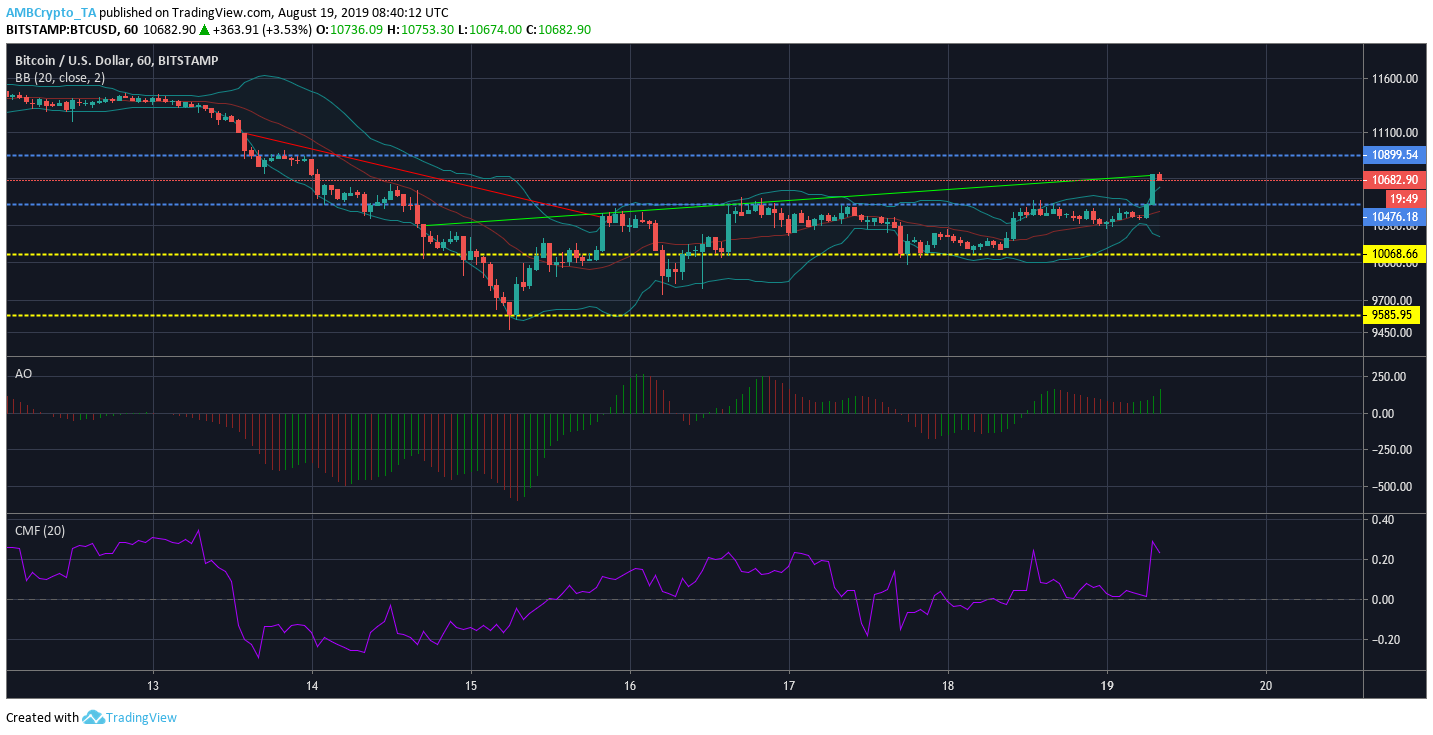
1-hour chart

Source: Trading View
Resistance 1: $10899.54
Resistance 2: $10476.18
Support 1: $10068.66
Support 2: $9585.95
Bitcoin’s short term chart indicated a downtrend which stretched the valuation from $11195.55 to $10385.56, followed up by an uptrend recovery which saw the price move from $10285.65 to $10734.2.
The Bollinger Bands indicators were pictured to be diverging in the charts which suggested the presence of volatility.
The Awesome Oscillator indicated bullish momentum for the coin as greens line appeared on the chart.
The Chaikin Money Flow or CMF suggested that capital coming into the market was more than capital going out since the indicator was above the zero-line.
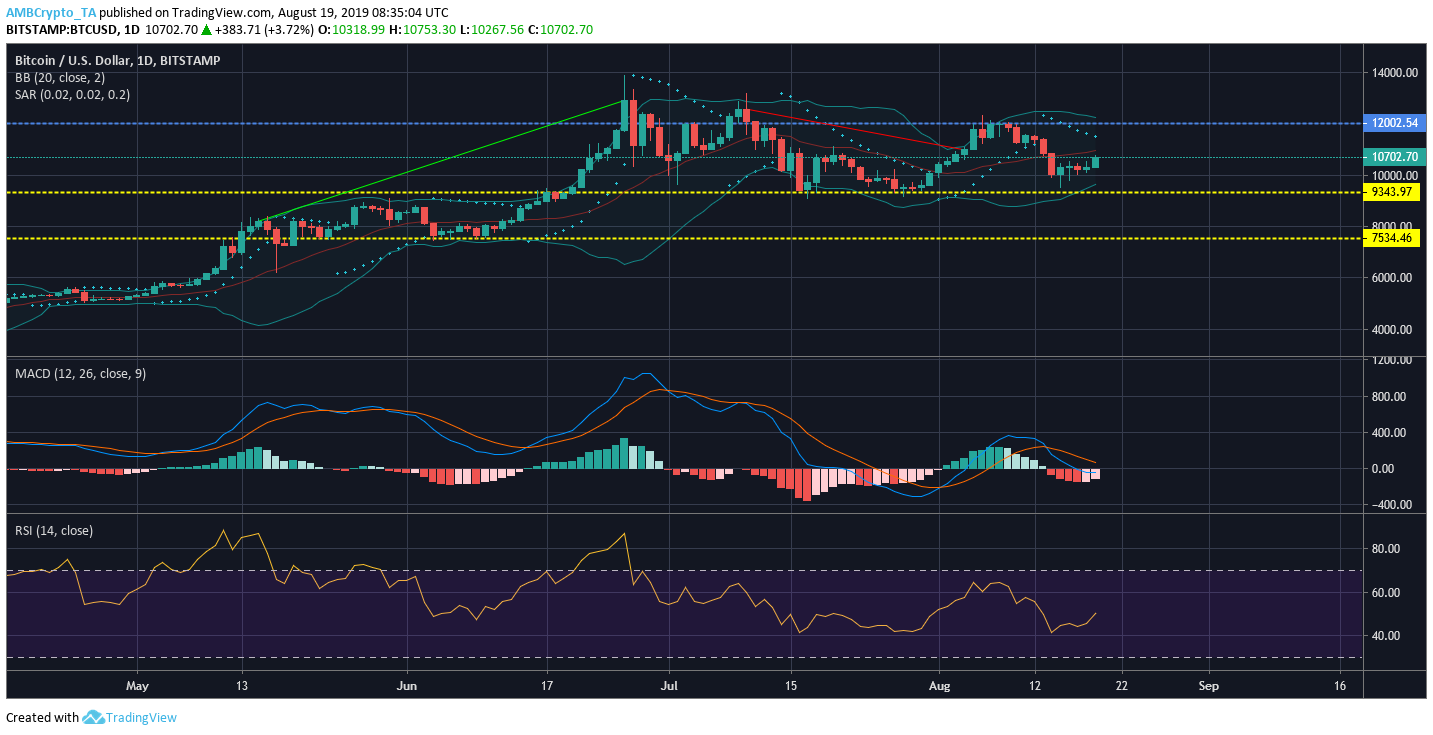
1-day chart

Source: Trading View
Resistance 1: $12002.54
Support 1: $9343.97
Support 2: $7534.46
The long term chart suggested that Bitcoin was continuing its path through the bearish trend after picturing a downtrend which saw the valuation slump from $12572.54 to $10982.4.
The Parabolic SAR remained bearish as the dotted lines remained above the candlesticks.
The MACD indicator suggested similar bearish traits as the signal line hovered over the MACD line.
The Relative Strength Index or RSI remained neutral, indicating BTC was neither over-sold not over-bought at press time.
Conclusion
Bitcoin’s valuation remained at a state of confusion as the long term indicators and short term indicators suggested opposing trend runs.


![Uniswap [UNI] price prediction - Traders, expect THIS after altcoin's 14% hike!](https://ambcrypto.com/wp-content/uploads/2024/12/UNI-1-400x240.webp)


