XRP Price Analysis: 25 January

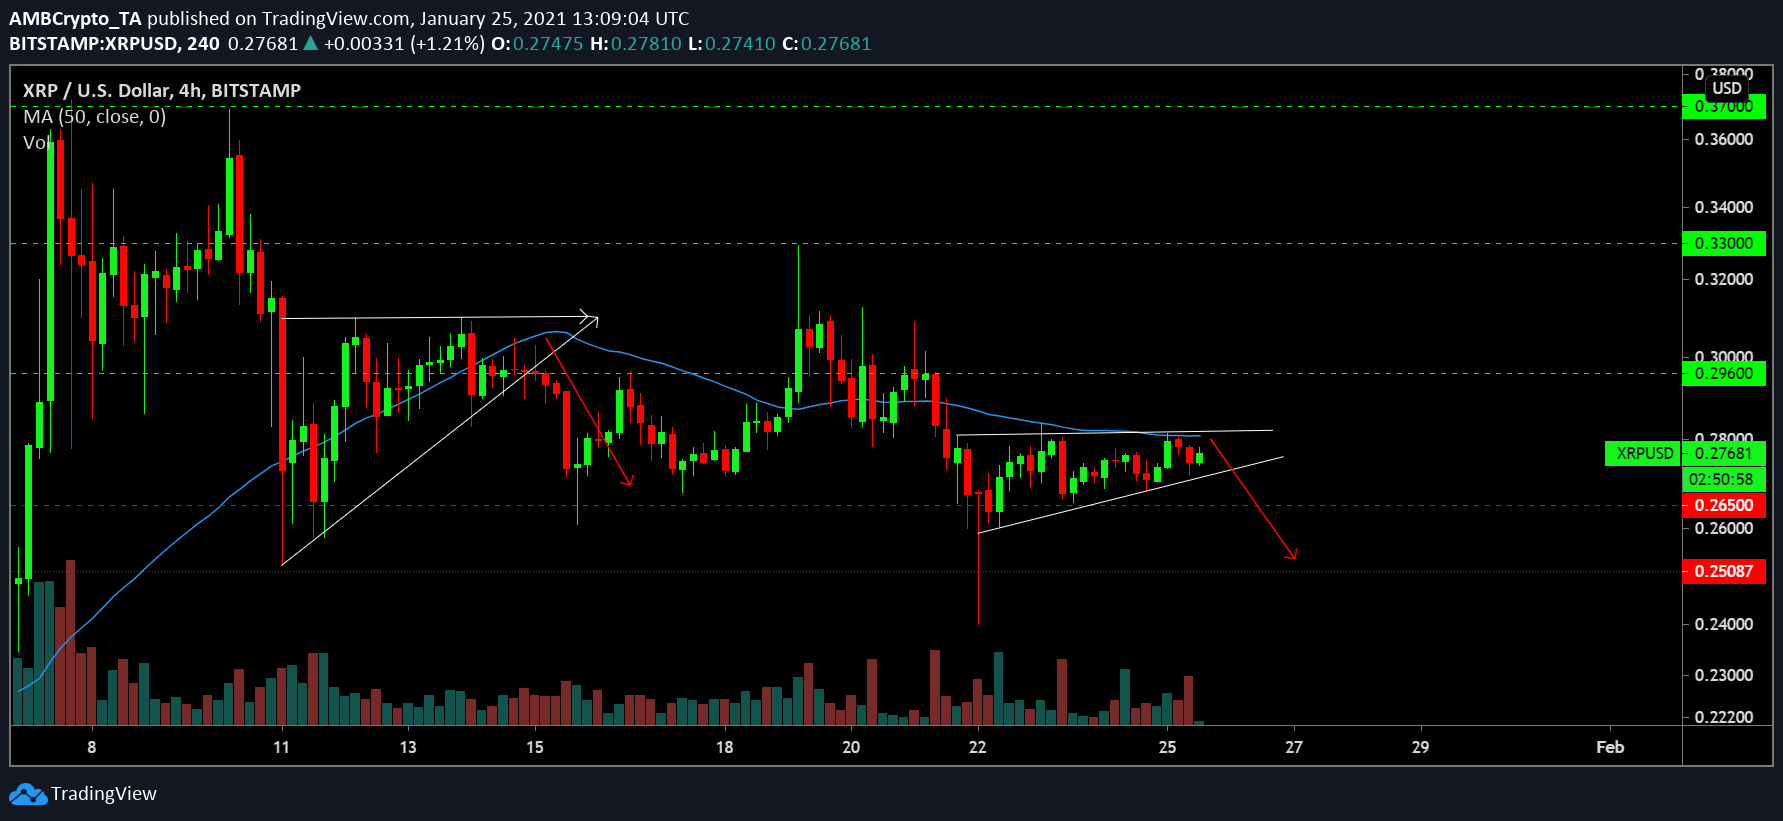
XRP has consistently struggled to break above the $0.3o range since its drop on 11th January. While a re-test at $0.33 was exhibited on the 19th, the asset may dip below the $0.25 level in the next 24-hours.
XRP 4-hour chart

Source: XRP/USD on Trading View
As illustrated in the 4-hour XRP chart, the price movement is currently in an ascending triangle. Although carrying bullish implications, there are a couple of situations that should be identified in the charts. Firstly, a similar pattern was formed during the 2nd week of January, which led to a massive fakeout and the price dropped down to $0.265. The main bearish presence back then was the overhead resistance thrust by the 50-Moving Average.
At press time, the situation is more or less the same. The 50-Moving Average continues to sustain overhead resistance, which opens up a possibility of another fakeout, enabling another re-test, possibly below $0.265.
While the bullish credential still carries forward, the chances of a bearish pullback cannot be ignored.
Market Rationale

Source: XRP/USD on Trading View
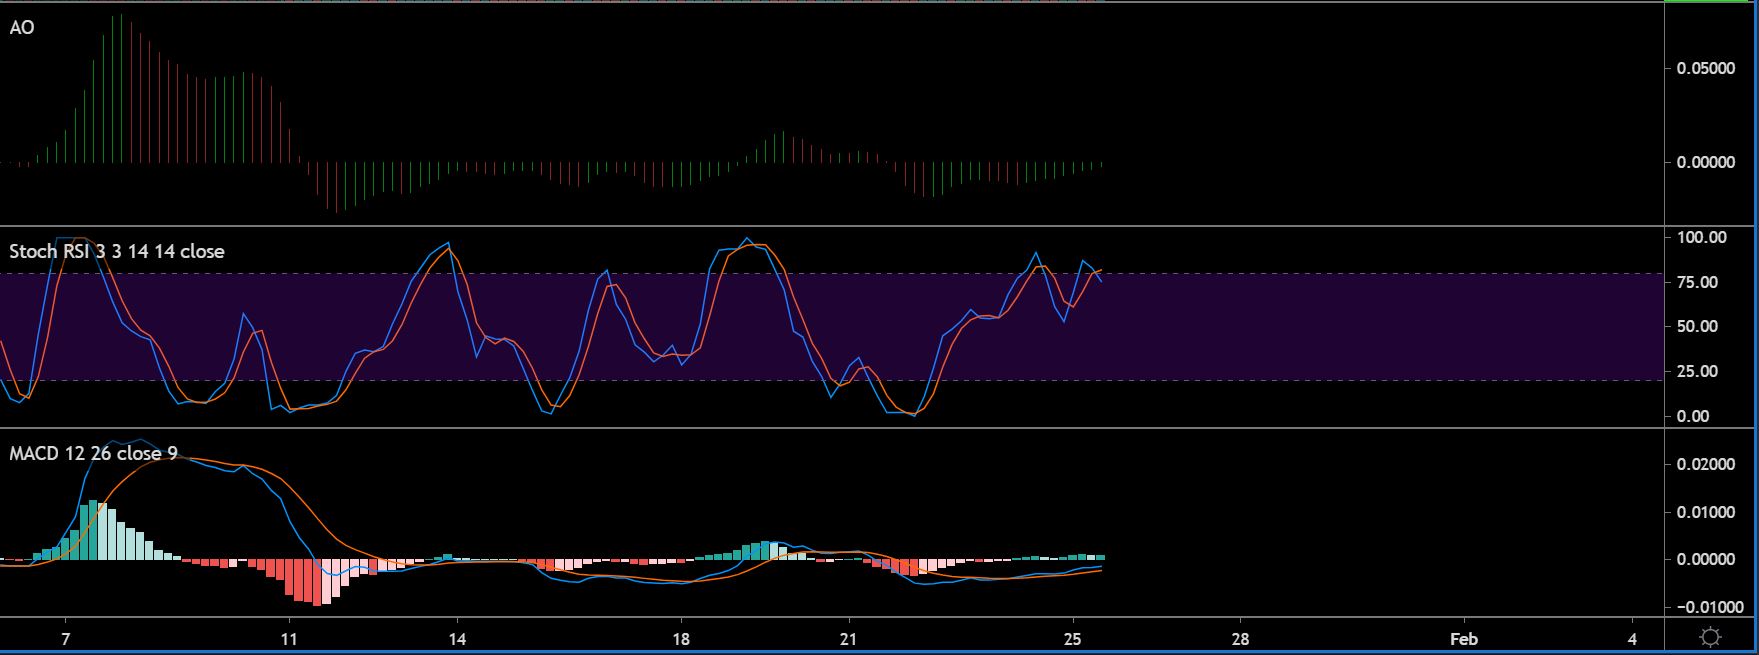
Market Indicators were split as there were some differences between the metrics. Awesome Oscillator or AO remained largely neutral at this point, but it may shift towards bullish momentum, considering green candles were more evident.
Stochastic RSI completed a bearish cross-over at the over-bought region, suggestive of a correction in the charts. On the other hand, MACD exhibited a bullish crossover which may lead to an upward rally going forward.
Conclusion
At this moment of time, patience is more important than any other virtue as XRP is incredibly susceptible to both trend shifts. While the pattern indicated a bullish turnaround, the past movement has suggested otherwise. Hence, the market needs to be monitored going forward.


