Bitcoin: Here’s what you can look at to minimize risk

Risk and trading go hand in hand and while risk may be part and parcel of the market today, the more pertinent question is – How much risk is worth taking? In light of the differences that exist between different markets, that’s a tricky question to answer. What can be answered, however, is how much of a risk appetite today’s traders and investors have.
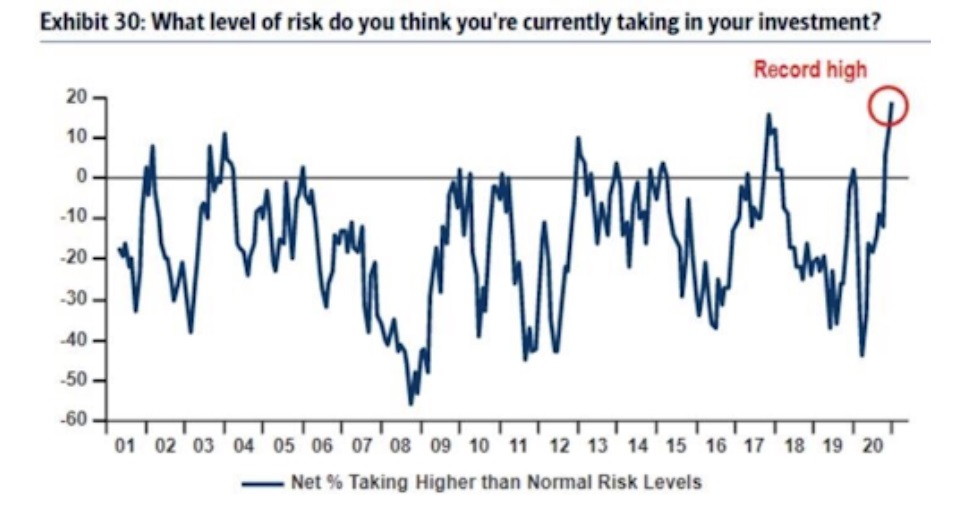
It is in this context that the Bank of America’s latest Global Fund Manager Survey should be read. According to the same, for the question “What level of risk do you think you’re currently taking in your investment,” the numbers have never been higher. Why is this the case? Well, some argue that while those who hold such huge, risky positions in stocks, for instance, are “viscerally uncomfortable,” they have no choice because of low returns on bonds and cash.
Ergo, it isn’t a surprise when traders and investors give equal attention to both profit-taking and risk minimization, whether they are shorting, using leverage, or dealing with illiquid positions. The same sentiment of self-preservation can be applied to participants in the crypto-market. Everyone is on the lookout for risk minimization. ZUBR’s latest research piece, however, claims that the solution may have been staring us in the face all along.
According to the same, “traders can use live blockchain analytics to assess market economics of supply and demand” to ensure a lower degree of risk and speculation. For the same, ZUBR recommended that metrics associated with Bitcoin and Tether [USDT] be kept an eye on.
Compiling data from Glassnode, ZUBR observed that in the year 2020, before the price rally pushed Bitcoin beyond its 2017-ATH and beyond $40,000 on the price charts, Bitcoin sitting on exchanges plummeted by over 600,000. The report added,
“From the time exchange balances peaked during the market crash of 2020, all the way through till the end of the year, deposits of Bitcoin ready for sale dwindled. From Bitcoin’s price bottom seen on ‘Black Thursday,’ exchange balances dropped by a massive 20%.”
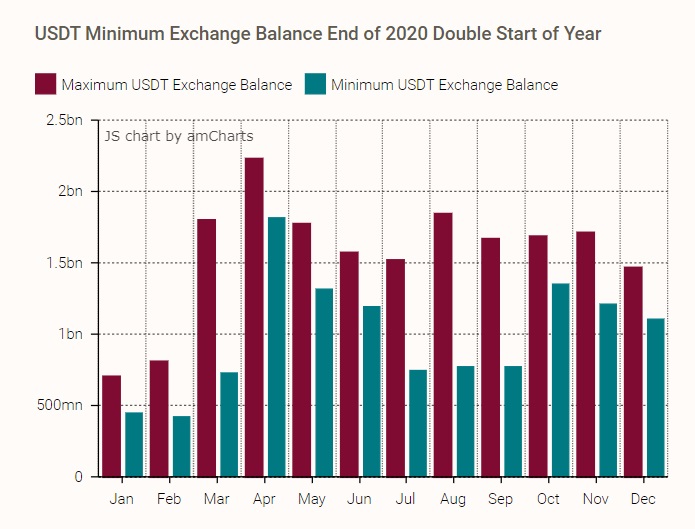
On the other side of the equation is Tether, the world’s most dominant stablecoin and popular choice as an on-ramp solution. While at the start of 2020 exchanges held an average of 500M USDT, the figures for the same ballooned up to $1.3B by the end of it.
Further, minimum exchange balances for USDT also registered a hike. In fact, figures for the same almost doubled, signaling that traders might be taking profits and waiting for more opportunities.
To make its point and highlight how these two metrics can be used to reliably predict the direction of price movement, ZUBR looked at blockchain activity over two days – 8 January (The day when BTC hit its ATH), and 11 January (The day it fell from over $38K to just under $31K).
For the same, the platform hypothesized that “for the overwhelming majority of extremely volatile days, blockchain has early tells.” According to the aforementioned report, “an initial supply increase jolt, followed by a confirmation by more supply moving onto exchanges along with price weakness will give traders the early signs of price direction.”
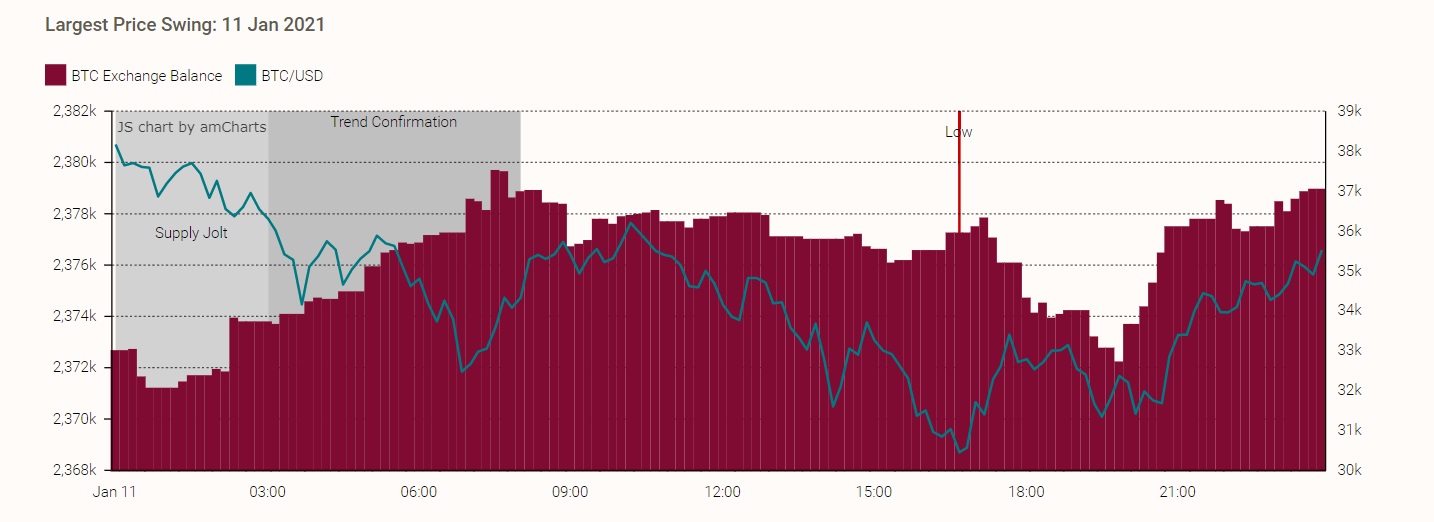
As can be seen from the chart, on 11 January, “a huge increase in supply on exchanges led to Bitcoin dropping by $8,000.” On the contrary, 08 January saw the market swing positively, with a supply drop of over 8K BTC followed by the cryptocurrency climbing to touch its ATH on the charts.

Now, assessing metrics such as supply and balances isn’t new. What is new, however, is how subtle changes in the same on an hourly basis can often be used to predict in which direction a crypto’s price may or may not swing.
These metrics are important when it comes to risk minimization, not only if you’re a day trader, but also if you’re looking for a long-term trend. After all, a cryptocurrency like Bitcoin may pump on the back of a tech entrepreneur’s Twitter update, but more often than not, it’ll always find level ground to begin from square one.
There’s a bright side to Bitcoin’s movements being dictated by fundamental metrics, however, something very predictable and perhaps, credible about the same.
This is especially so when we compare the present-day rally to the one back in 2017. While the latter was mostly driven by retail and FOMO, the present rally is driven by genuine forces of demand and supply. Thanks to the same, on-chain metrics today can be used to provide a more accurate assessment of what’s coming.
And because it’s easier this time around, risk management can be an easier burden too.