Tron, Algorand, Nano Price Analysis: 02 April

Tron formed a triangle pattern on the charts and was heading back to the $0.084-support. Algorand projected neutral momentum in the short term, while Nano’s bulls looked to flip the $5-level from resistance to support.
Tron [TRX]

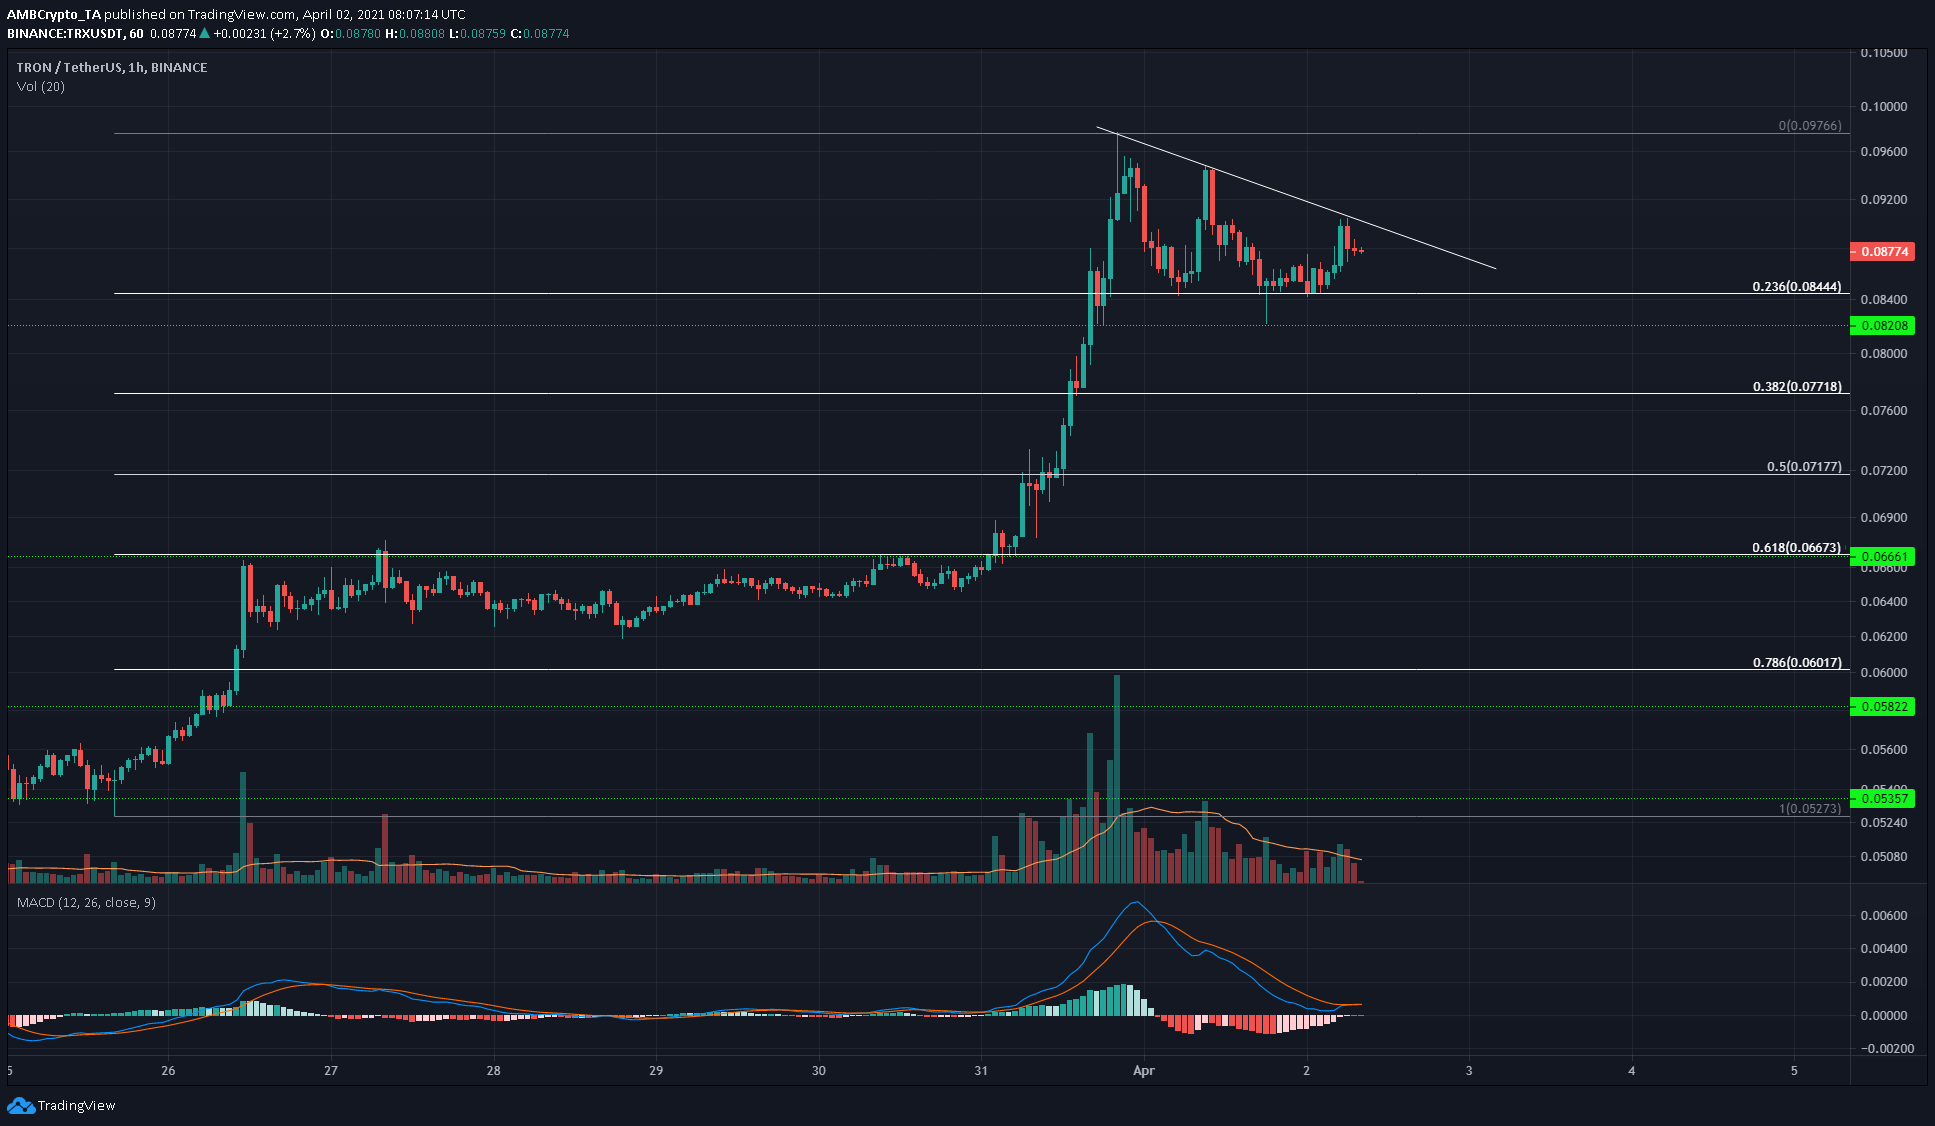
Source: TRX/USDT on TradingView
TRX formed a descending triangle pattern on the hourly chart. The trading volume was trending downwards. The MACD showed neutral to slightly bullish momentum on the hourly chart, although longer timeframe charts registered a strongly bullish TRX.
A breakout north of this pattern will see TRX climb back to $0.097 while losing the 23.6% retracement level to bearish pressure will see TRX pushed lower to $0.082 and $0.077.
Algorand [ALGO]

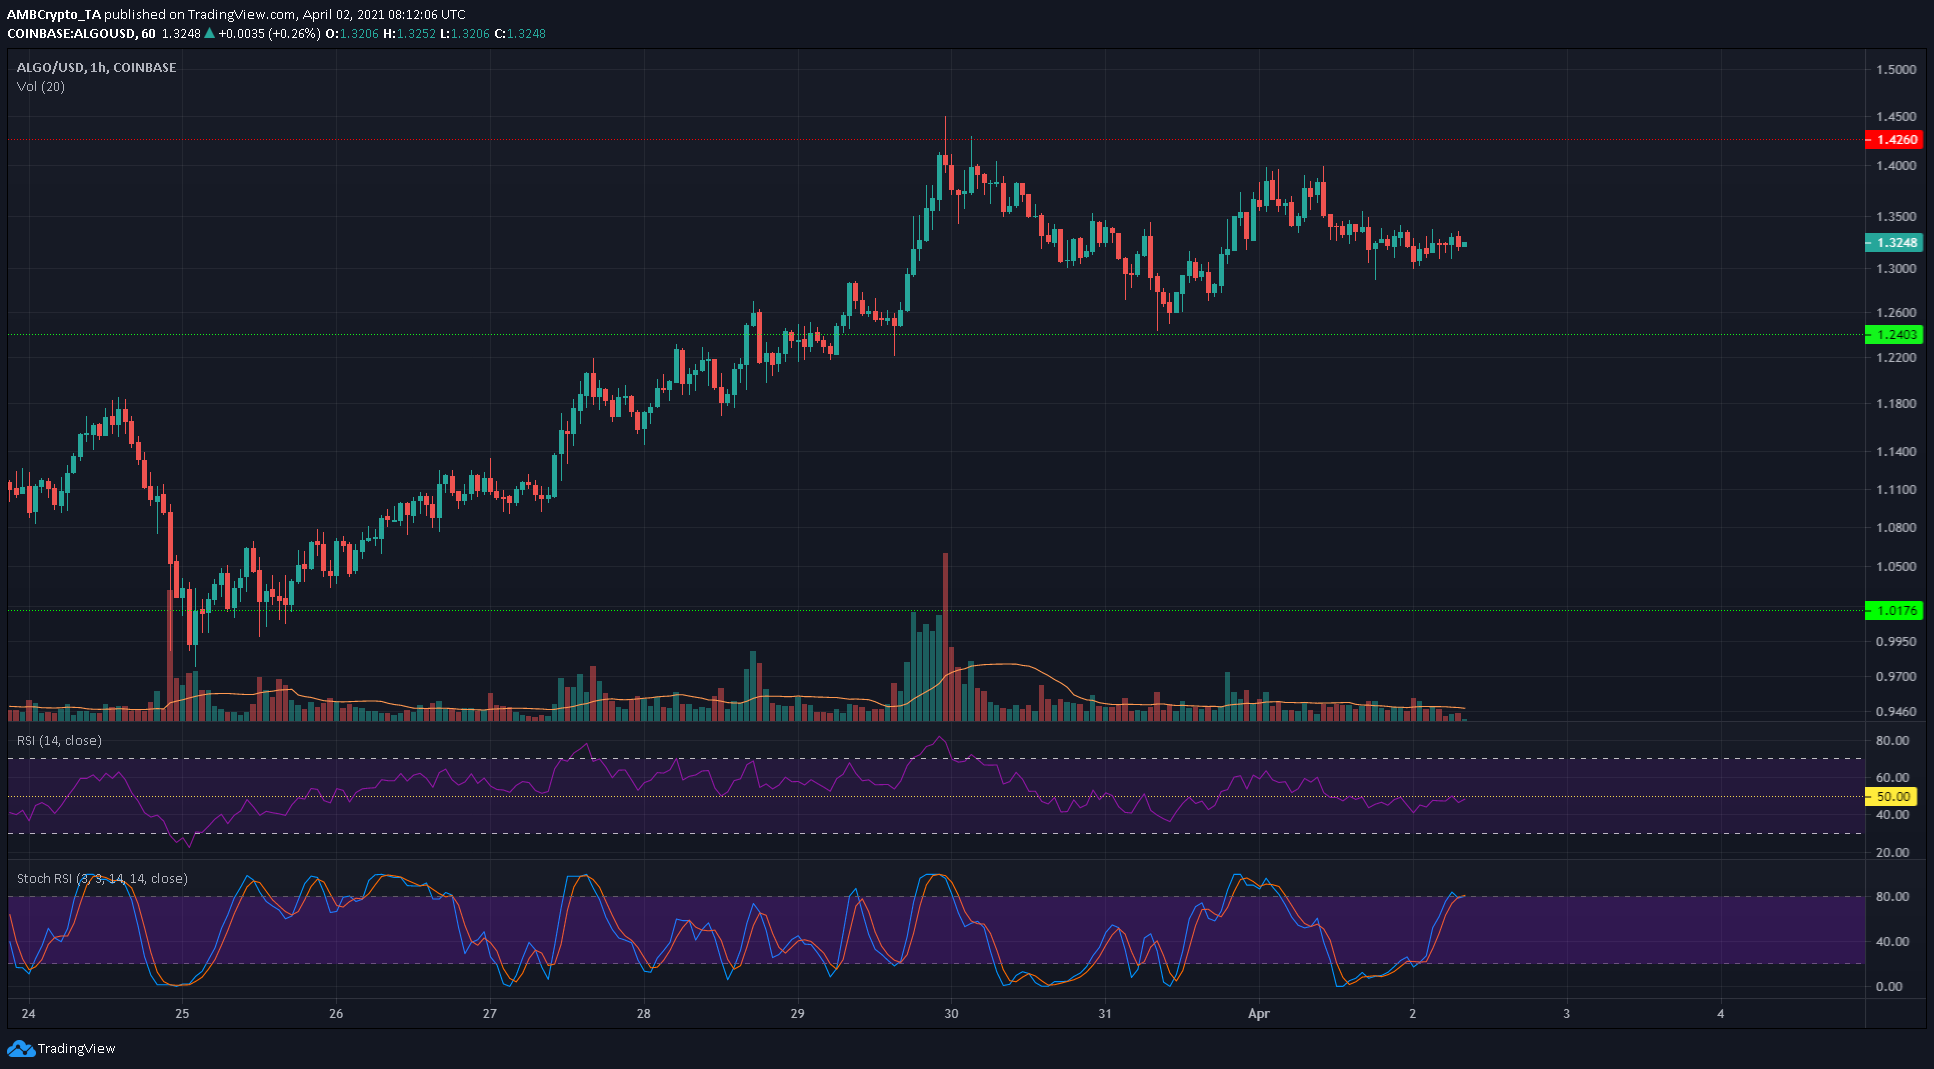
Source: ALGO/USD on TradingView
ALGO tested the $1.42-level as resistance and formed a higher low as the support at $1.24 saw buyers step in. At the time of writing, momentum was neutral for ALGO, according to the RSI.
A revisit to $1.24-$1.28 will likely be an area to buy ALGO and $1.42 would be the take-profit for those buys in the coming days. A trading session close below $1.22 could see bears flip this level from resistance to support.
The $1.31-mark was in the middle of these two levels of support and resistance and the reaction of ALGO at this mark would further influence its short-term direction. Defending this level could see ALGO bounce back towards $1.42, or losing this level will likely see ALGO head back to $1.24.
Nano [NANO]

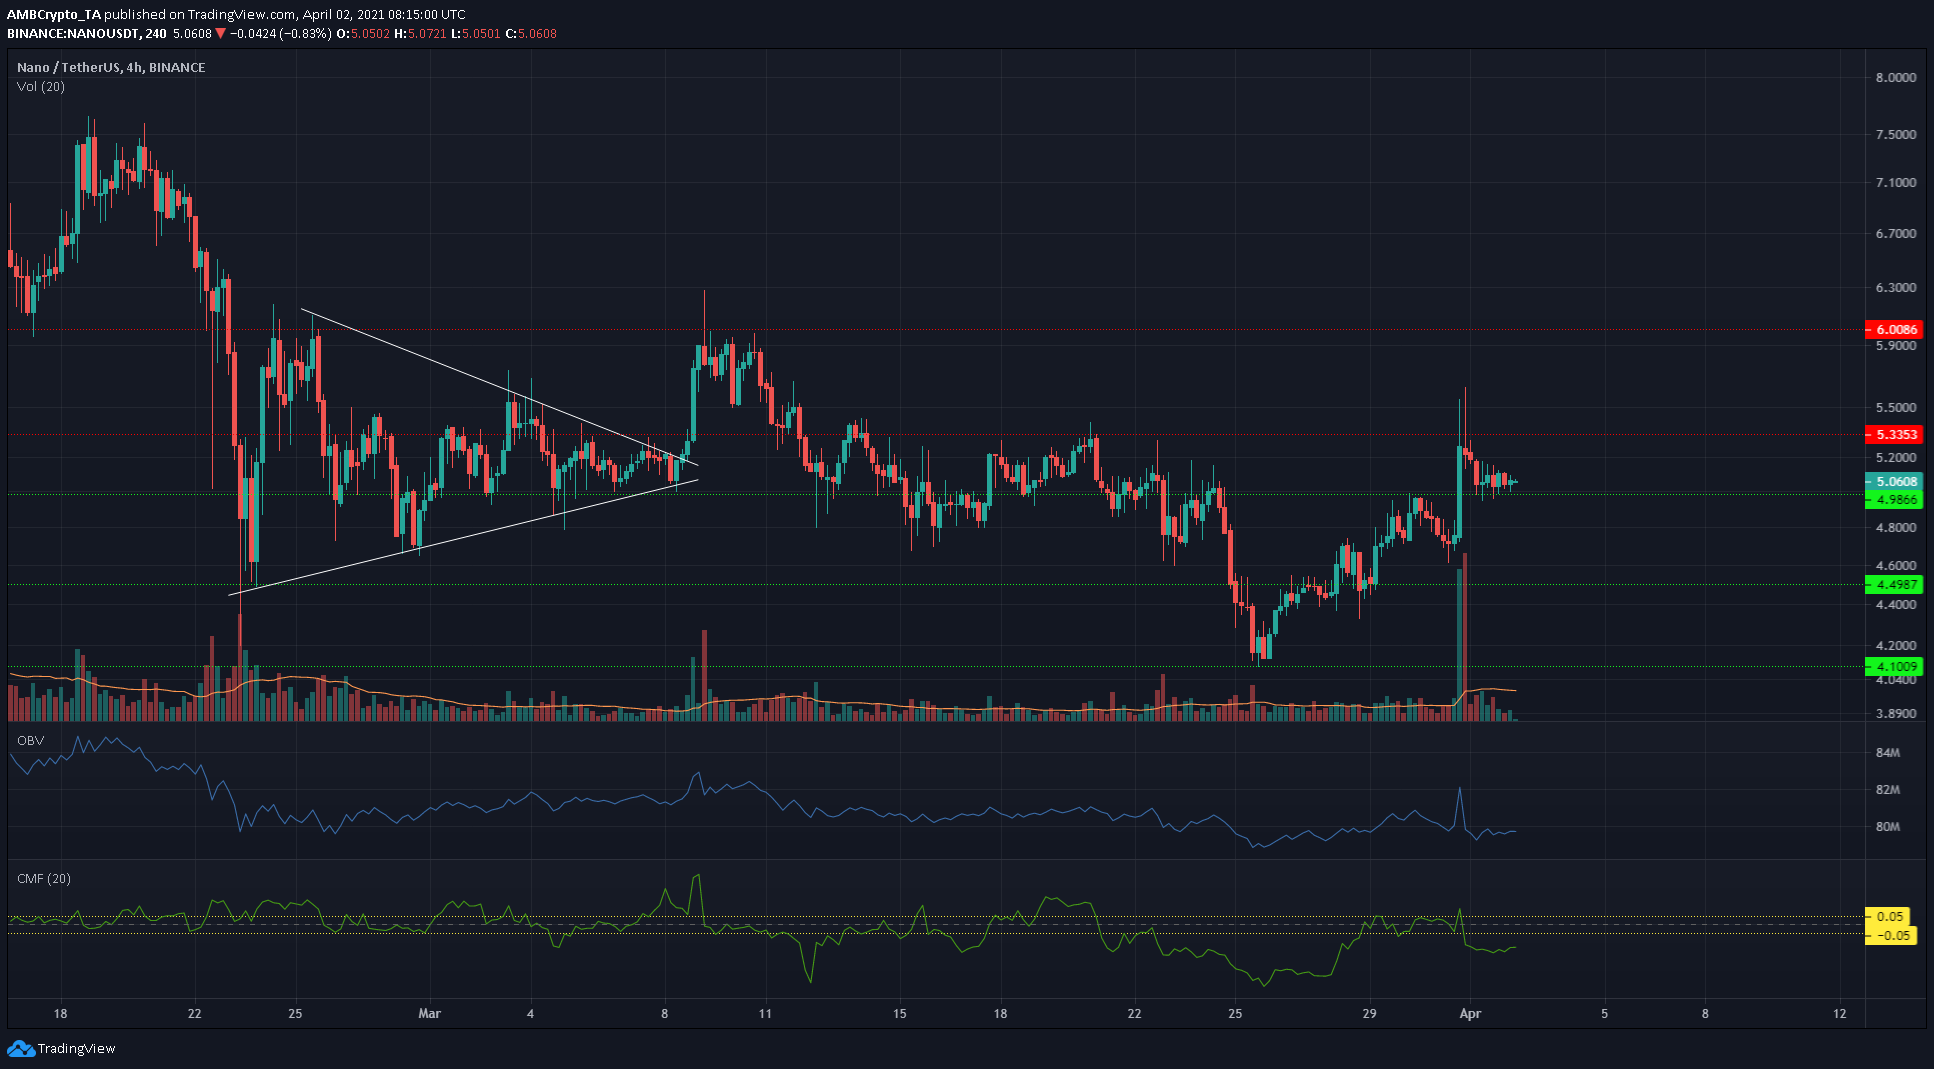
Source: NANO/USDT on TradingView
The short-term was definitely bullish for NANO since it bounced off the $4.1-level over the past week and made steady gains to climb to $5.5, before seeing a pullback to test the $5-support level.
However, on the 4-hour chart, it can be seen that $5.33 is an important level of resistance. The OBV has been trending downwards since late February, and the Chaikin Money Flow dropped below the -0.05 mark once more after intense selling prevented NANO from closing a session above $5.33.
The $4.98-$5 zone is an important support and the $5.33-level is the overhead resistance. This level will offer buying opportunities if bulls flip it to support.


