Ethereum Price Analysis: 22 April

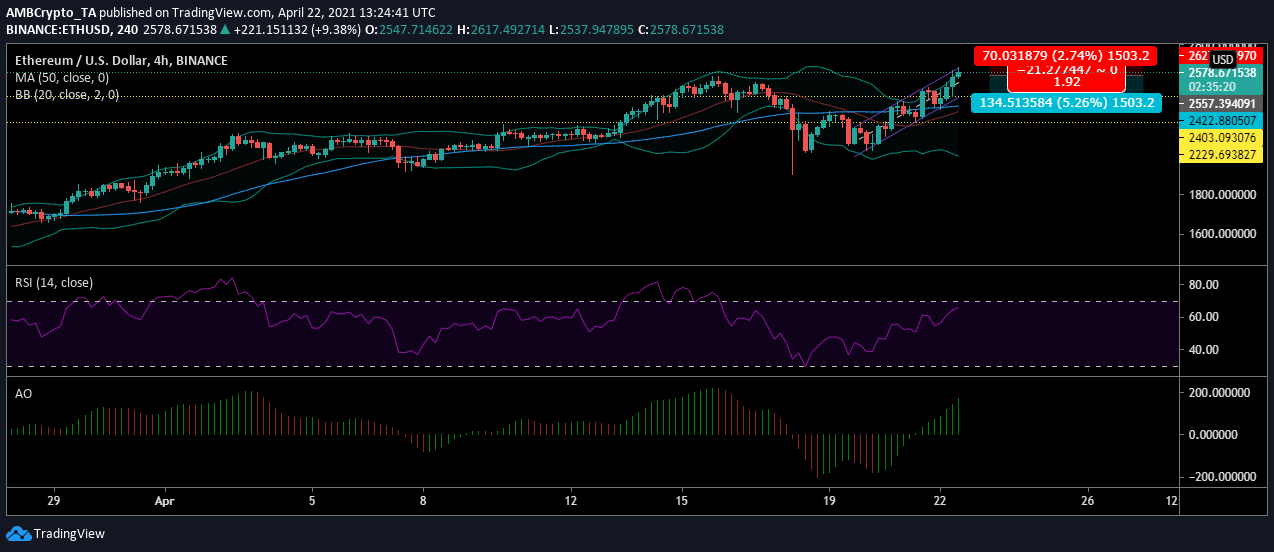
Ethereum price hit a new all-time high on 22 April at $2,617. This occurred at a time when the Bitcoin market was recovering from the fall on Sunday. The price of ETH has been surging and pushed past through various levels of resistances and was trading at $2,582.
Ethereum four-hour chart

Source: ETHUSD on TradingView
The ETH chart indicated that the price was moving under the support line at $2,229 until a surge pushed the price above. Buyers flooded the market and carried the price above $2,403 and reported a new all-time high.
Given the high volatility in the market, the price may witness a turnaround as the asset becomes overbought.
Reasoning
Bollinger Bands indicated that the market was open for high volatility. This meant that even though the price has surged, volatility could also cause a large correction. Meanwhile, the signal line was under the candlesticks indicating that the price was on an uptrend.
Relative strength index confirmed that the buyers were in the market. The digital asset was being pushed higher closer to the overbought zone. The price may plunge as the asset gets overbought and the high momentum could cause the price to drop further.
Crucial levels
Entry-level: $2,557.39
Take profit: $2,422.88
Stop-level: $2,627.42
Risk to Reward: 1.92
Conclusion
The current chart of Ethereum [ETH] was indicating that the price was at an all-time high. However, the rising price may take a turn to the lower side as the digital asset gets overbought and tests support at $2,403. The momentum may fuel the falling price and the short-traders may want to seize the opportunity to benefit from an upcoming correction.


![Cardano's [ADA] rally hinges on ONE condition - Will the whales follow or flee?](https://ambcrypto.com/wp-content/uploads/2025/05/Evans-60-min-400x240.png)
![Ripple [XRP] has drawn increased investor optimism as both crowd and smart money sentiment indicators have turned bullish.](https://ambcrypto.com/wp-content/uploads/2025/05/Erastus-2025-05-15T132209.200-min-400x240.png)