Bitcoin: Is this the price target after ascending channel breakout?

Disclaimer: The findings of the following analysis are the sole opinions of the writer and should not be taken as investment advice
While Bitcoin trailblazed itself above $40,000 when the week began, Bitcoin hasn’t been able to stop bearish pressure from taking over. The past 4 days have been painted in red, with the king coin struggling to hold a position above $37,000. BTC’s immediate support had been turned into resistance and other patterns, at press time, were breaking against the fortunes of the digital asset.
At press time, Bitcoin’s market cap had dropped down under $700 billion, with the cryptocurrency noting a daily change of -4.6%.
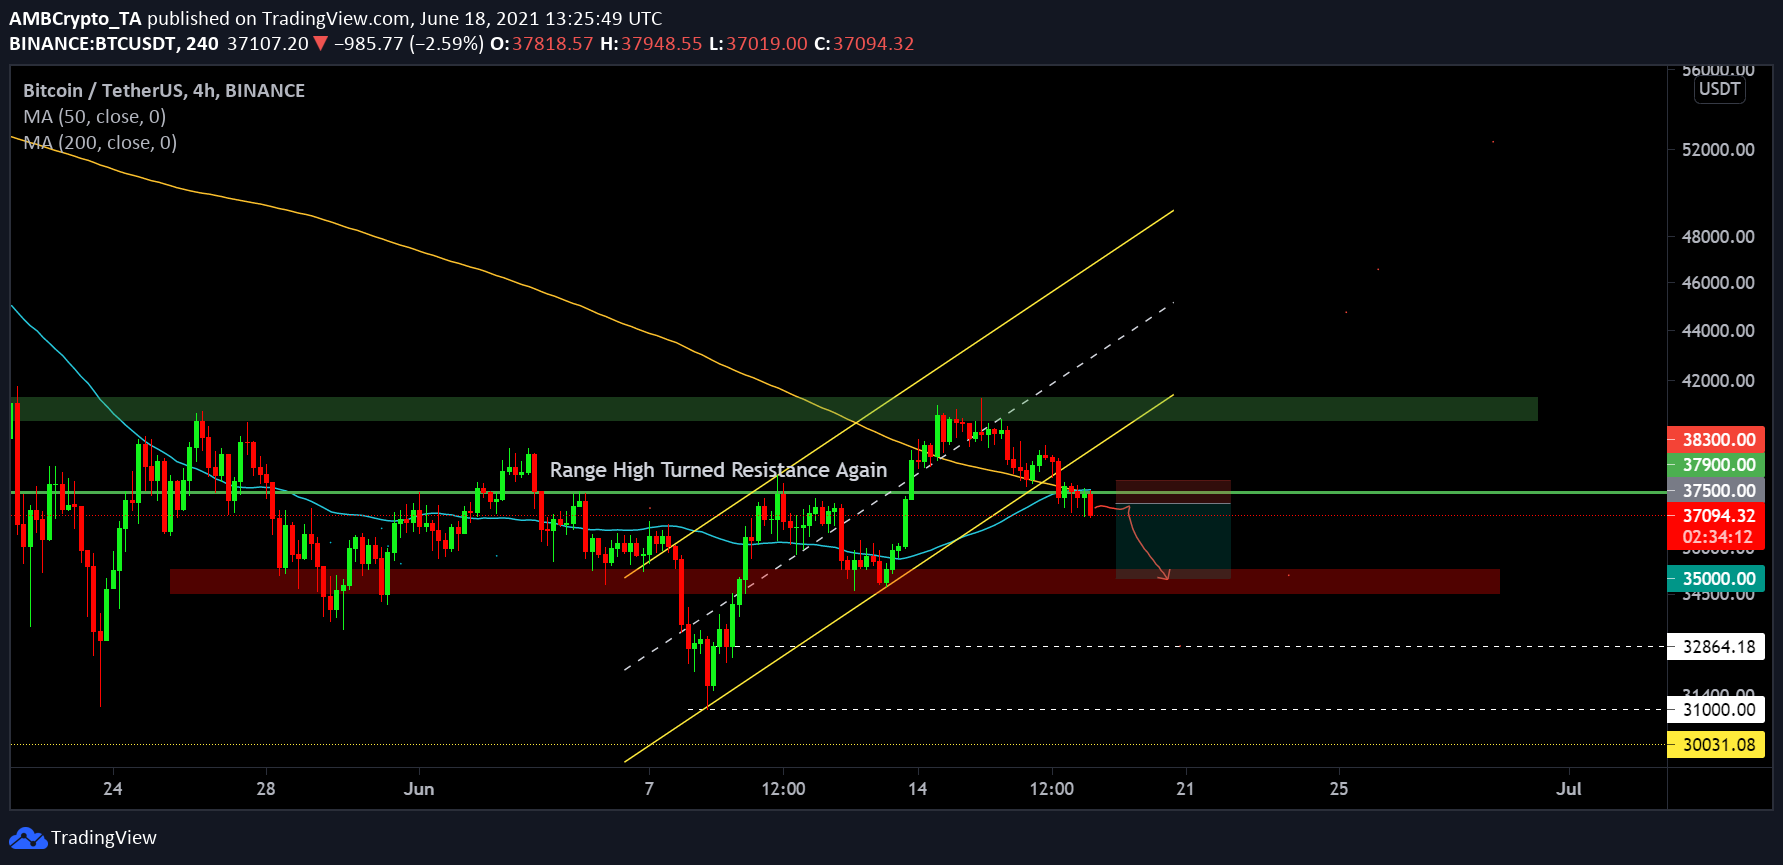
Bitcoin 4-hour chart

Source: BTC/USDT on Trading View
At press time, there were a couple of factors that were playing against Bitcoin’s bullish recovery. First of all, Bitcoin has completed a bearish breakout from its ascending channel pattern, a development that confirmed the bearish pressure on the chart. Secondly, the asset hasn’t been able to hold a position above the range-high support of $37,900. At the time of writing, it was acting as an immediate resistance, and the asset has consolidated under the limit for the past 16 hours.
The 200-Moving Average, which was acting as support earlier in the week, turned into an active resistance as well, with the 50-Moving Average flipping bearish an hour back. For a bullish narrative to remain in place, Bitcoin must find resort above the $37,900-limit, but the probability was extremely slim at press time.
Market Rationale
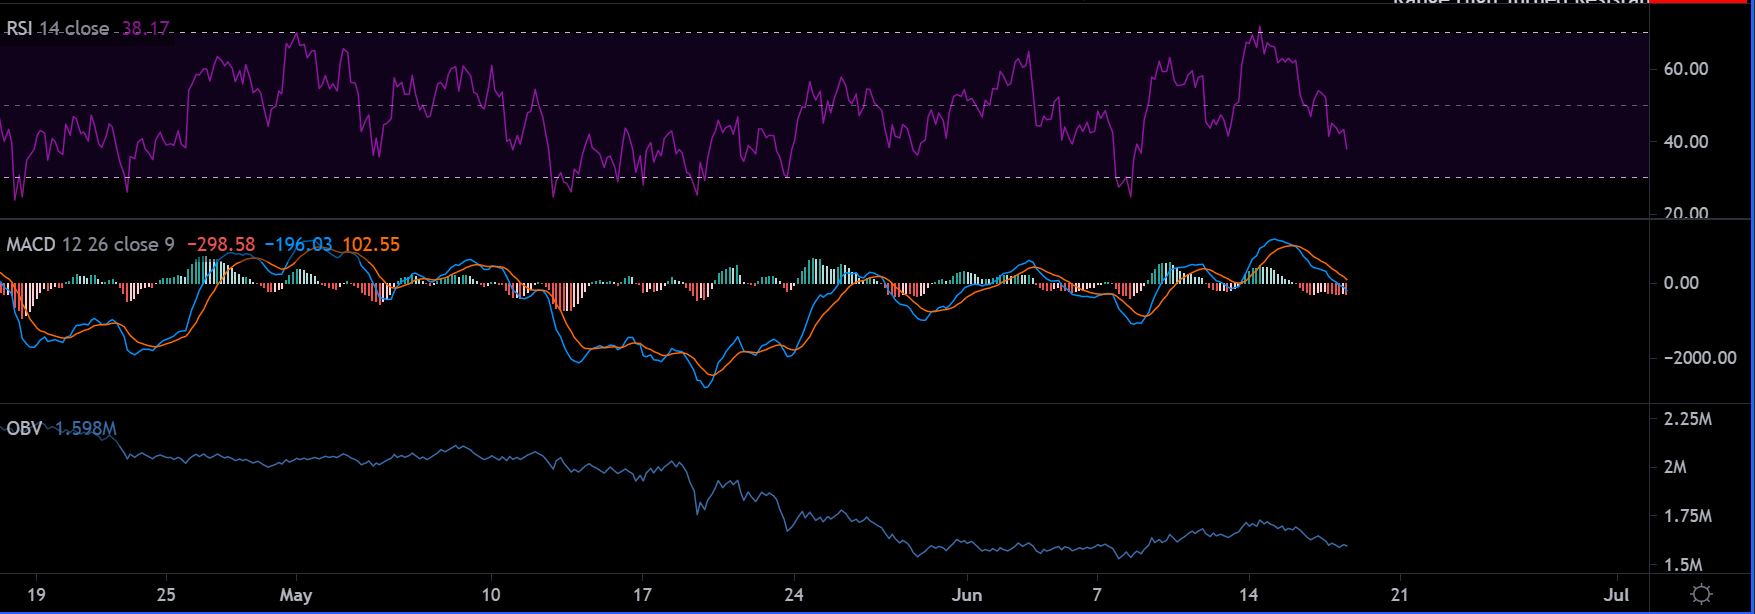
According to the Relative Strength Index, selling pressure has continued to dominate buying pressure since the 15th of June, which is unfolding with respect to the price action as well. The MACD line has continued to point to a bearish trend on the charts, with the Signal line properly placed above the former.
Finally, On-balance volumes suggested that selling pressure remains prominent as buyers haven’t been able to sustain consistent recovery over the past few weeks.
Important Levels to watch out for
Keeping all the signals in context, a short position is ideal at the moment,
Short Position Entry: $37500
Stop-Loss: $38300
Take Profit: $35,000
Risk/Reward Ratio: 3.13x


