Binance Coin, MATIC, Litecoin Price Analysis: 23 June

China’s attempt to clamp down on crypto-trading negatively impacted altcoins, an action that fueled a hike in price volatility over the week. At press time, as Bitcoin’s price recovered by 7.5%, most major altcoins were trading in the green.
Binance Coin’s trading volume, for instance, rose by 110% while MATIC still held on to its crucial support level. Finally, Litecoin noted a minor price correction over the last 24 hours.
Binance Coin [BNB]

Source: BNB/USD, TradingView
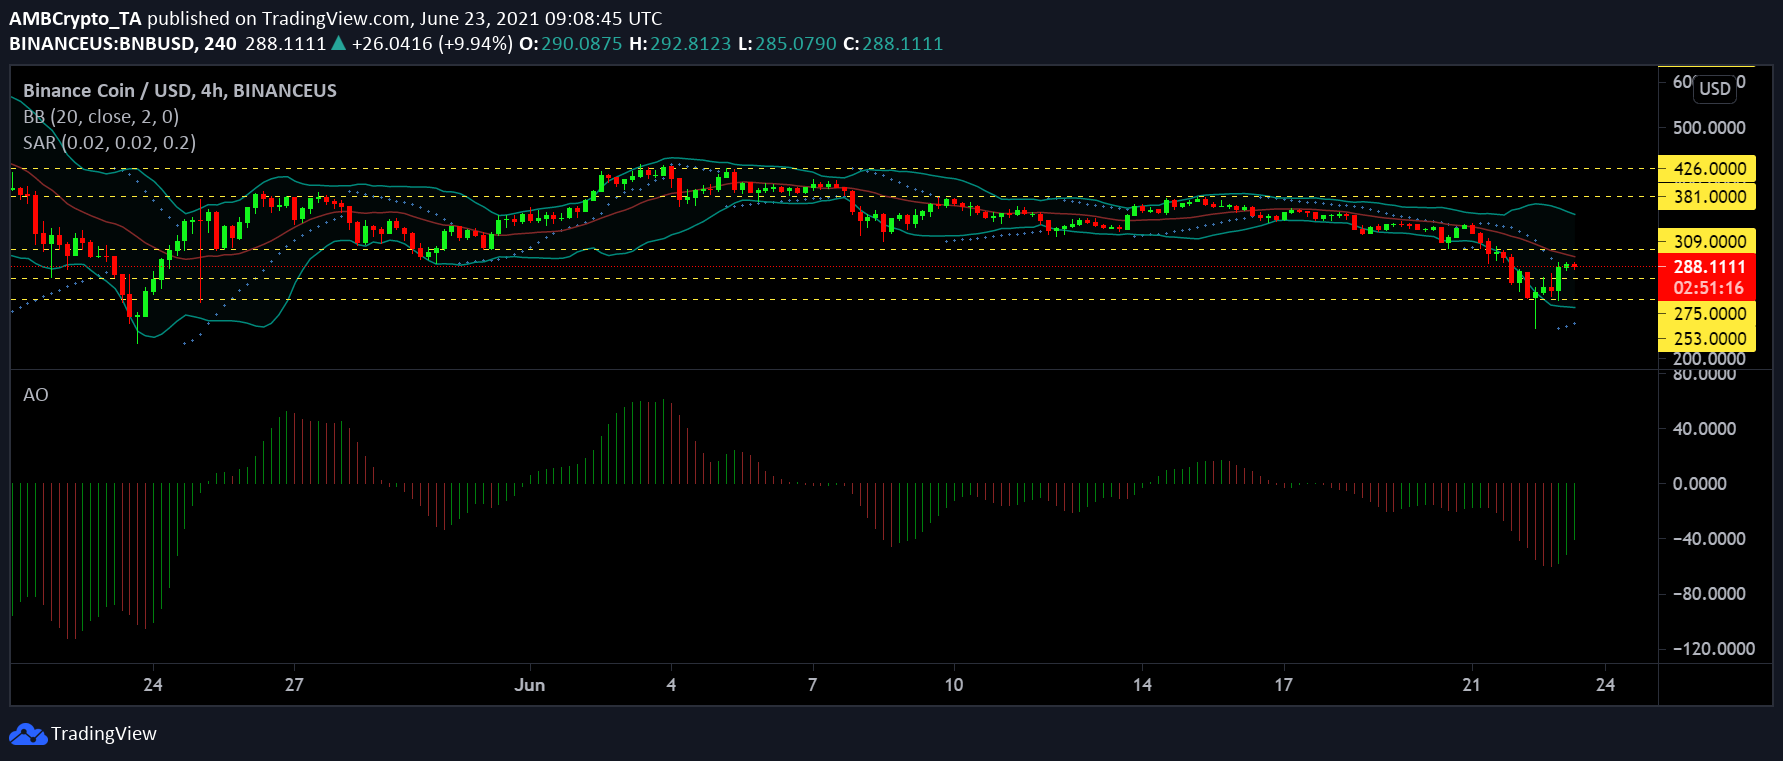
Binance Coin’s prices recovered by 8.3% in 24 hours and it was valued at $288.95, at the time of writing. It’s worth noting, however, that BNB had broken through the $290-support level two days ago.
With a further hike in prices, the token could potentially go above the $290-level over the next few trading sessions.
The Bollinger Bands continued to diverge on the charts, a sign of incoming price volatility. With BNB’s price appreciating over the last few trading sessions, the Parabolic SAR pointed to an emerging uptrend.
The Awesome Oscillator’s histogram pictured bullish momentum taking over on the charts.
MATIC

Source: MATIC/USD, TradingView
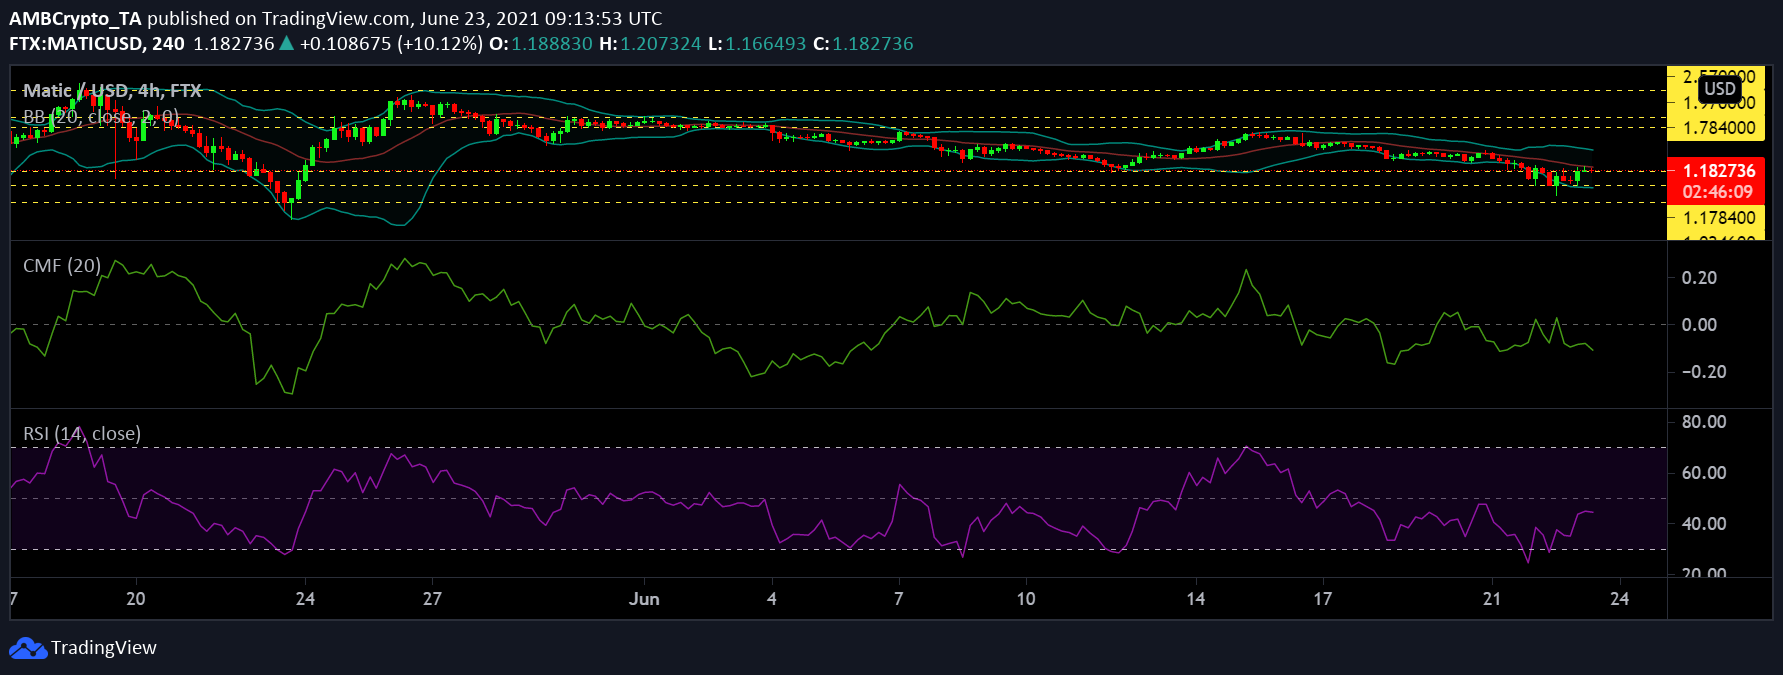
MATIC has mostly registered lateral price movements across the chart since the beginning of June. While it appreciated somewhat of late, the coin’s valuation fell by almost 27% in a week. What’s more, the altcoin has managed to stay above its $1.04-crucial support level and it was trading at $1.19 at press time.
The coin’s press time price action hovered around the same range as on 23 May as a result of the crypto-crash last month. Going by the previous patterns, the price could stand a chance of consolidating.
The Relative Strength Index hung closer to the neutral zone, but at press time, selling pressure was observed to be higher than buying pressure. The Bollinger Bands remained parallel with very little divergence and the price can be expected to remain stable over the next few trading sessions.
As per the Chaikin Money Flow, capital outflows continued to exceed capital inflows.
Litecoin [LTC]

Source: LTC/USD, TradingView
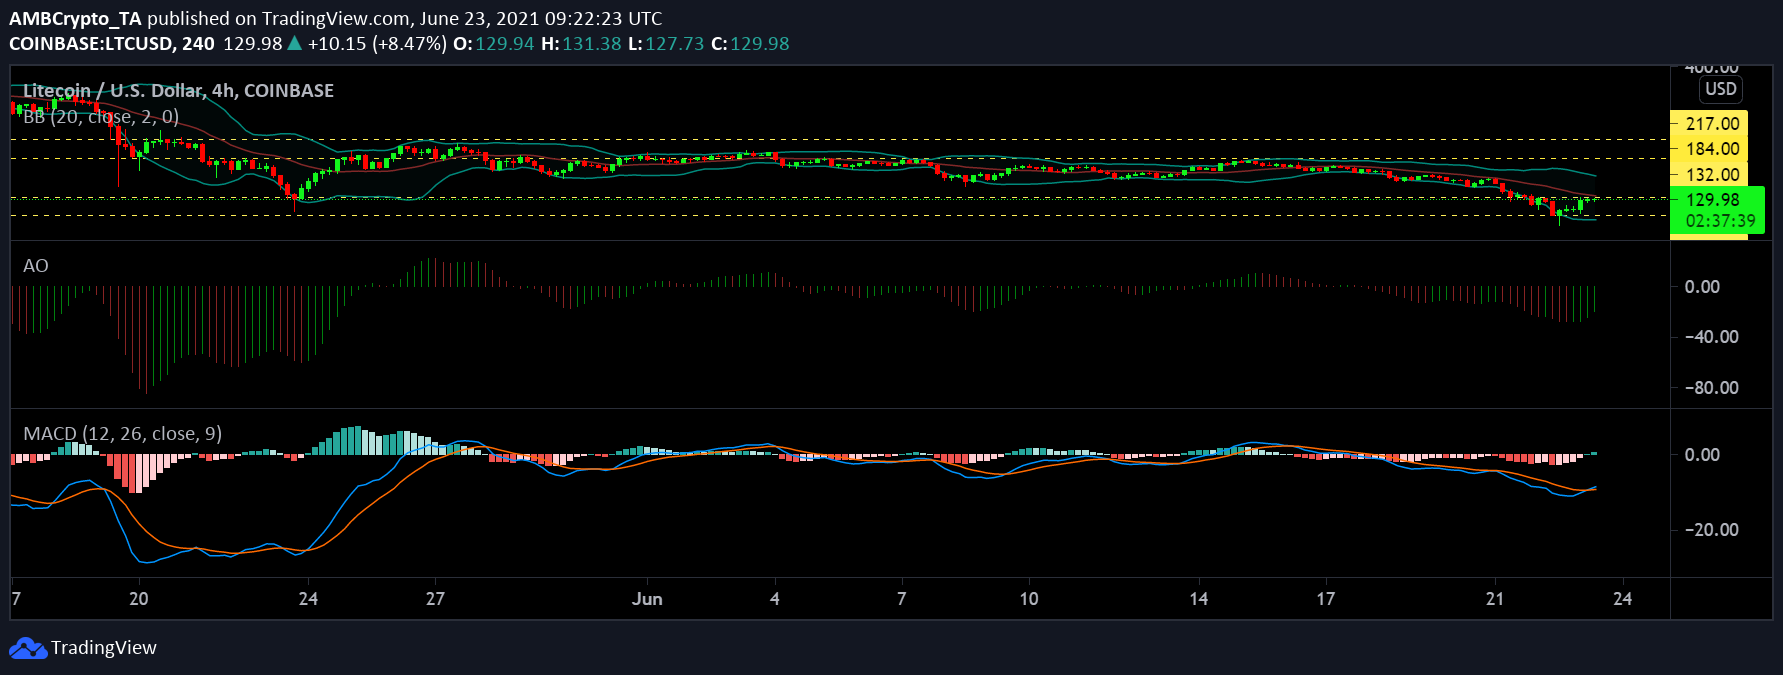
At the time of writing, LTC had risen by 9.03% and was trading at $129.26. On the 4-hour trading chart, the coin showed signs of a corrective rebound.
The coin had dipped to $119, which was its lowest since May 23. Moving forward, if the bulls manage to push the price up, the coin can be expected to find resistance at $132.
After projecting bearish momentum for almost a week, as shown by the MACD indicator, bullish momentum seemed to emerge at press time. The Awesome Oscillator too suggested something similar.
Finally, the Bollinger Bands underlined a hike in price volatility.


