Considering these factors, Polkadot did not seem ready for this move

At the time of writing, Polkadot bagged an unwanted record of the biggest weekly loser among the top 30 coins by market cap. Prices were treading in dangerous waters below their 50, 100 and 200 Simple Moving Average lines and lay vulnerable to a sharper decline.
A broader market recovery did offer some respite but the bulls had their work cut out for them. At the time of writing, Polkadot traded at $15.2, up by 5% over the last 24 hours.
Polkadot Daily Chart

Source: DOT/USD, TradingView
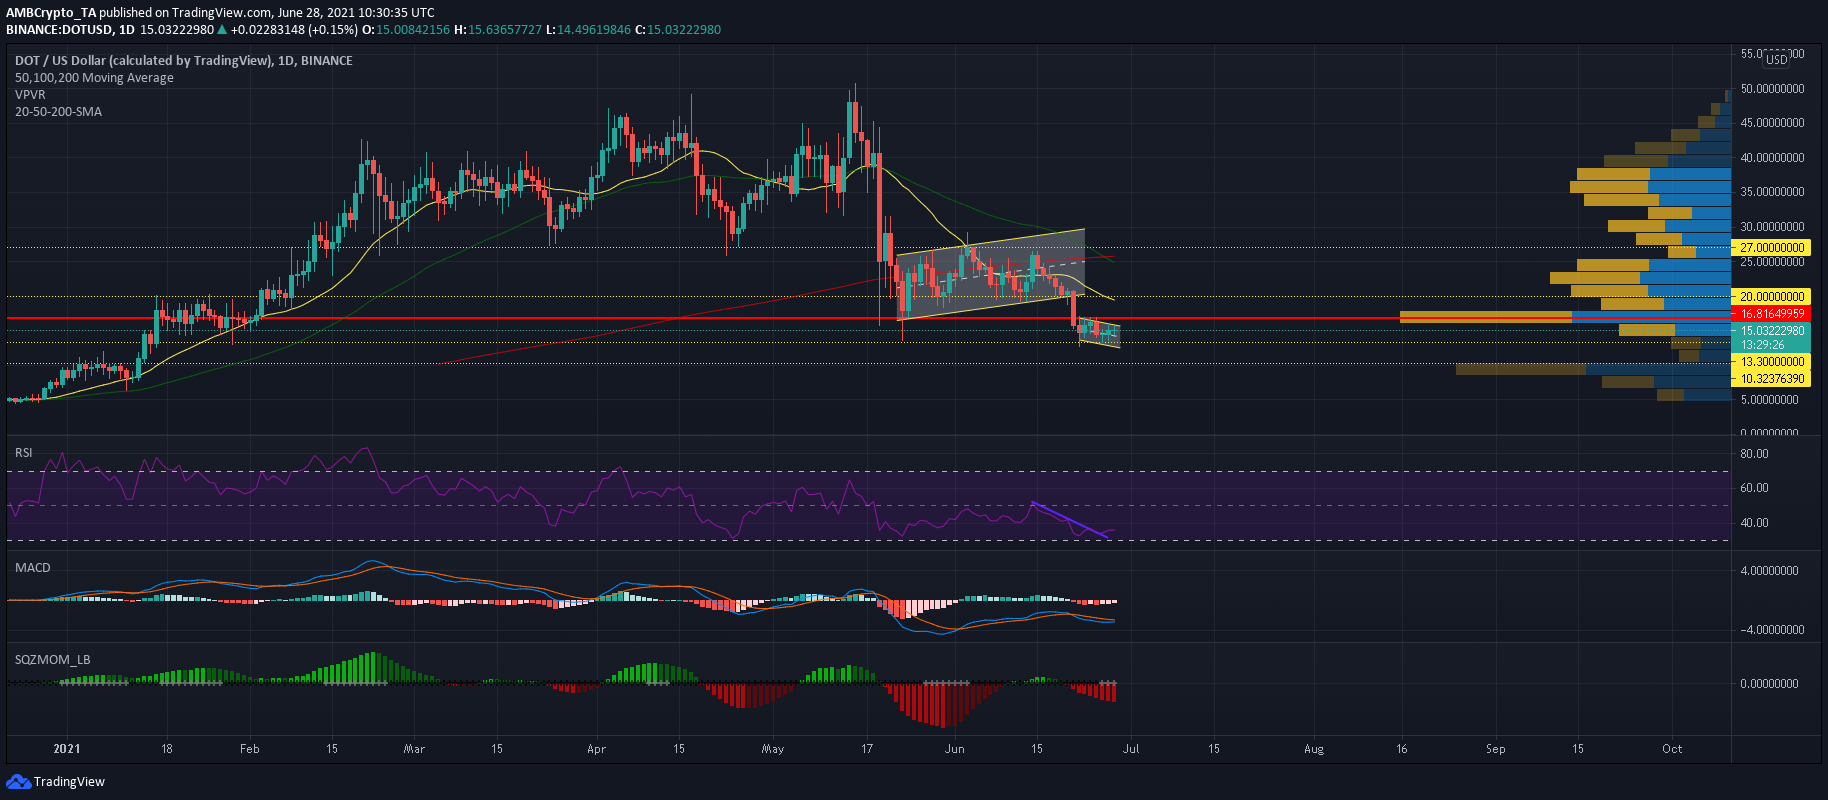
While bulls have attempted a gradual recovery in the market, an ascending-channel breakdown was a critical turning point. Losses accumulated to 35% as DOT pierced below its bottom trendline and shifted back towards its 19 May low of $13.5. A single candlewick even dropped as low as $12.75- representing a near 5-month low for the digital asset.
Since the decline, DOT has largely traded close to the aforementioned defensive line with neither side able to tilt the market in their favor. The formation of a down-channel did present chances of an upward breakout but several obstacles lay ahead. The Visible Range showed high interest for DOT around $16.5 and a successful close above this level could push prices towards the $20-mark and 20-SMA (red). The next challenge lay at the $27 price ceiling- an area that saw some interplay between the 200 (red) and 50 (green) moving average lines.
Reasoning
The Relative Strength Index pointed north in bearish territory. A move above the neutral zone would indicate bullish strength and the potential of another rally. The MACD line closed in on the Signal line and a successful crossover would highlight a potential trend shift. However, the Squeeze Momentum Indicator suggested that bearish momentum could limit bullish control moving forward.
Considering the above factors, DOT did not seem ready for a favorable breakout just yet and gains could be limited to the Visible Range’s point of control at $16.8. If bearish momentum fizzles out, a rise towards $20 can be expected in the coming days. On the other hand, a close below $13.3 could spell trouble for the cryptocurrency and trigger another decline.
Conclusion
A safer bet on Polkadot would be to wait for a breakout above key levels before initiating a trade. A close above $17 could boost DOT towards the $20-22 mark but the threat of another breakdown cannot be discounted.


