At what level is a bullish breakout likely for MATIC?

MATIC’s price has had its fair share of troubles lately. Weekly losses of 14% were the second-highest among the top 15 coins by market cap and a descending channel appeared once prices failed to topple $1.75 resistance. However, its pattern did suggest a break to the upside but questions remained with respect to the price level. At the time of writing, MATIC traded at $1.13, up by 3% over the last 24 hours.
MATIC Daily Chart
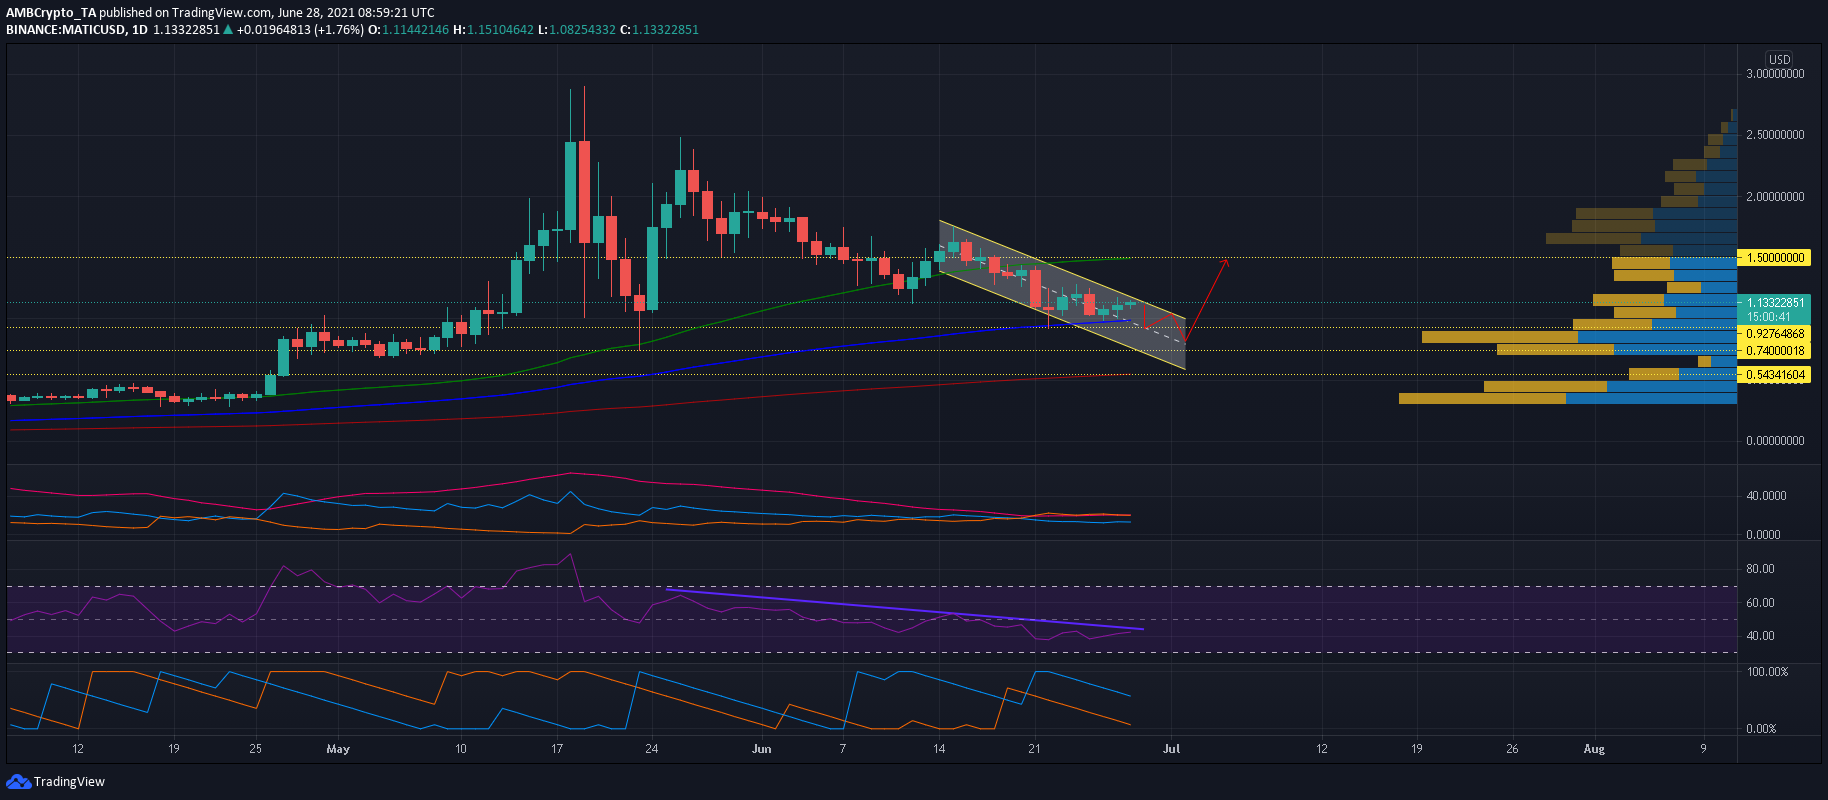
Although MATIC has attempted to keep its head above the ground after the 19 May sell-off, bears have been quick to respond to several rallies in the market. A failed breakout attempt above $1.75 saw the formation of a down-channel which had already heightened losses of over 30% since mid-June. The 100 Moving Average Line (blue) lent support as a breakdown from the channel was avoided. Now trading close to the upper trendline of its pattern, a breakout could push MATIC back towards the $1.50 mark and 50-MA (green). However, such an outcome was not that clear-cut.
Reasoning
Even though MATIC was trading in the green, its Relative Strength Index moved within the bearish-neutral territory. The upper sloping trendline suggested some more downside and a potential reset into the oversold territory before bulls assert their control. Such an outcome would likely see MATIC head back towards its 19 May low of $0.74. The Aroon up traded below the Aroon down and suggested that a bearish trend was still in play.
The Directional Movement Index also confirmed with the Aroon. The -DI line hovered above the +DI line, although both were in close proximity. An ADX reading of 20 meant that sharp price swings were unlikely over the coming days. With that in mind, MATIC could see slightly lower levels before breaking north from its pattern. The region between $0.86-0.74 saw a high amount of interest for MATIC according to the Visible Range and had a higher potential to enable the next rally. However, bulls must be wary of an extended decline considering an overall bear market. A close below $0.74 could thwart prices down towards its 200-SMA (red) and $0.54- a level seen last April.
Conclusion
Over the coming days, MATIC was projected to dip slightly lower within its descending channel but the region between $0.86-0.74 had the potential to push MATIC back towards its 50-MA. However, it was hard to place bets on MATIC since the threat of a sell-off was always around the corner. A move below $0.74 could result in another 25% decline towards April levels of $0.54.


