Assessing the impact of Cardano failing to make this move

Cardano is one of those altcoins that has managed to actually walk the walk. In fact, the network is on its way to introduce smart contracts by October 2021 with Alonzo. However, has the altcoin’s price actually been keeping up with its growing popularity? Based on the recent market rally led by Bitcoin, the answer seems to be in the negative. So, will it be able to catch up? Or is it about to go down the other way?
Cardano following Bitcoin?
Not really.
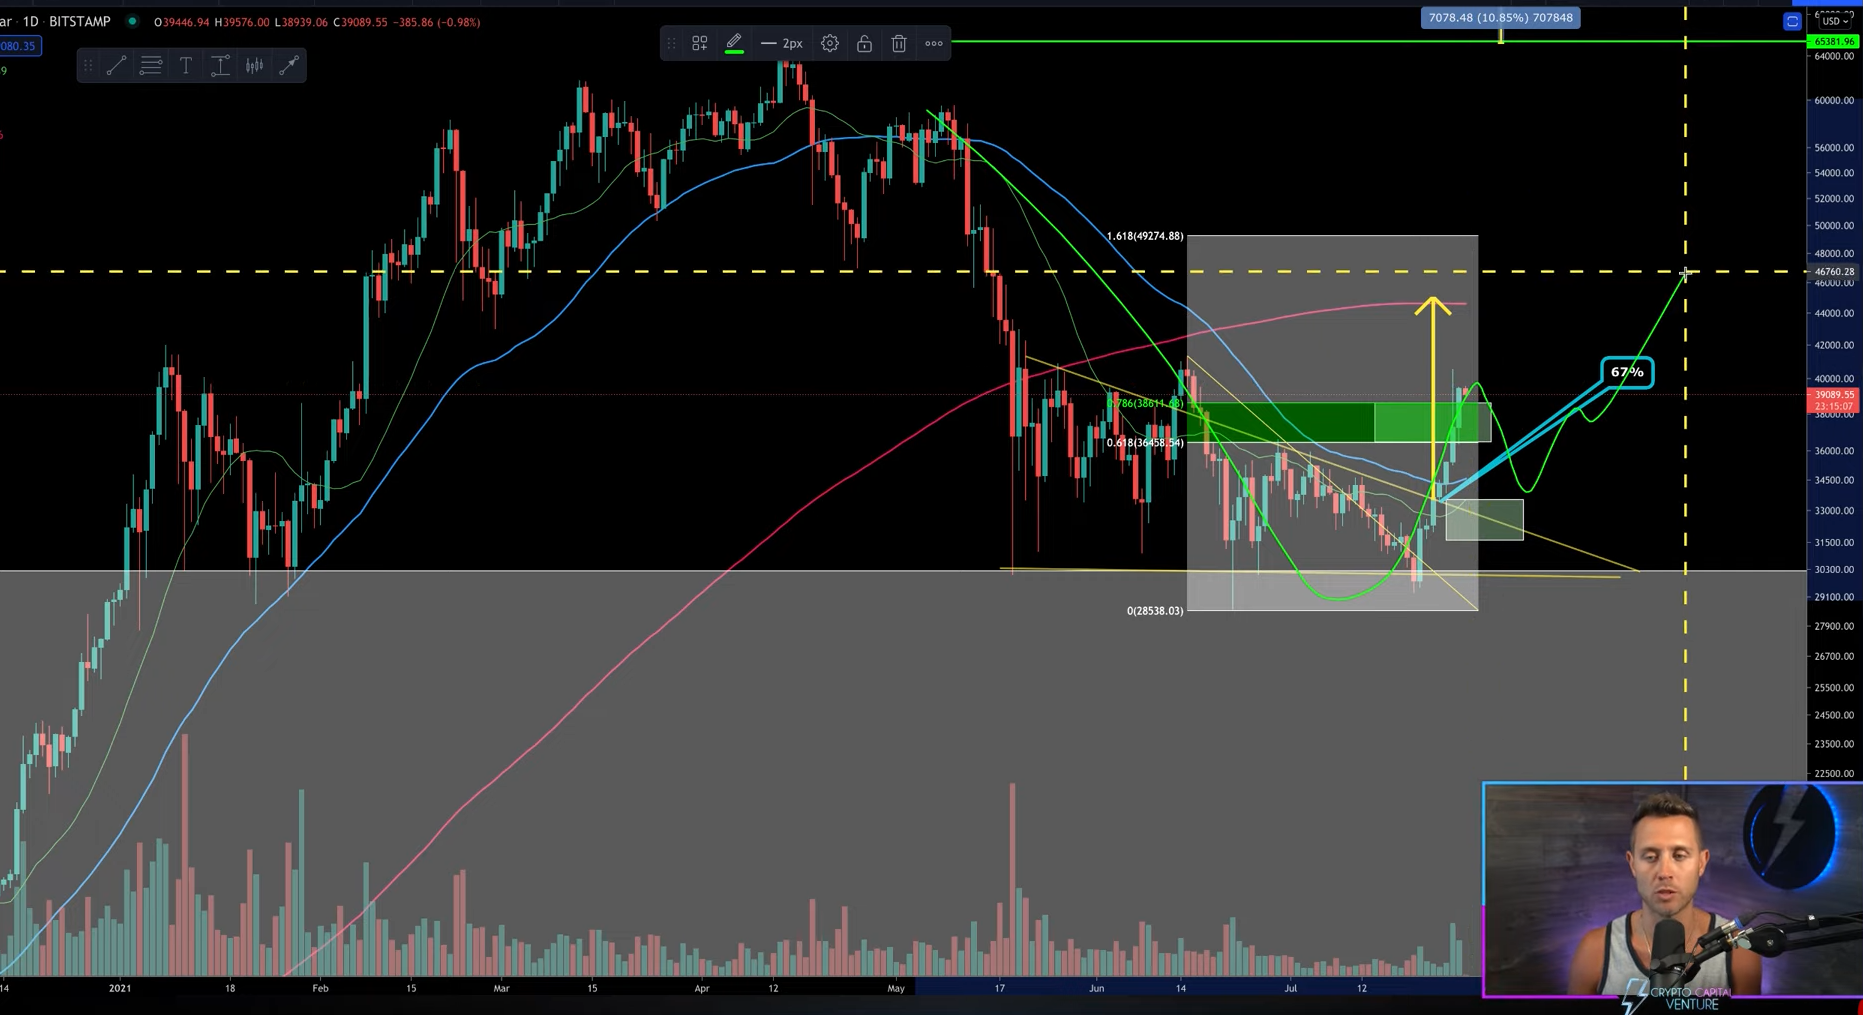
Despite the fact that BTC was up by 35.4% after this week’s rally at press time, ADA only rose by 22.4%. Bitcoin managed to breach its Fibonacci bull market doors, levels which BTC consolidated under for over a month. As BTC’s price hit $40k, it broke the door’s resistance and traded above it, albeit briefly.
However, according to Dan Gambardello, this sudden hike will need an equivalent correction, one that could force Bitcoin to form higher lows. In fact, these higher lows could form along the range of $31,000 – $32,000.

Bitcoin important levels | Source: Crypto Capital Venture
Such a correction would put Bitcoin on the path towards a steady hike. Additionally, the 20-week Moving Average will serve as the breaker level for the king coin. In order to register a strong bull run, BTC will have to turn it into support.
Cardano, on the other hand, seemed to be heading in a very different direction.
Important Cardano levels to watch out for
ADA’s price movement has been observed to jump after every hard fork. All the upgrades that came to the network brought with it a bull run. With the Alonzo hard fork on the way, something similar might be possible. Cardano’s price could enter the bull market pattern its charts previously displayed and ADA can start moving north.
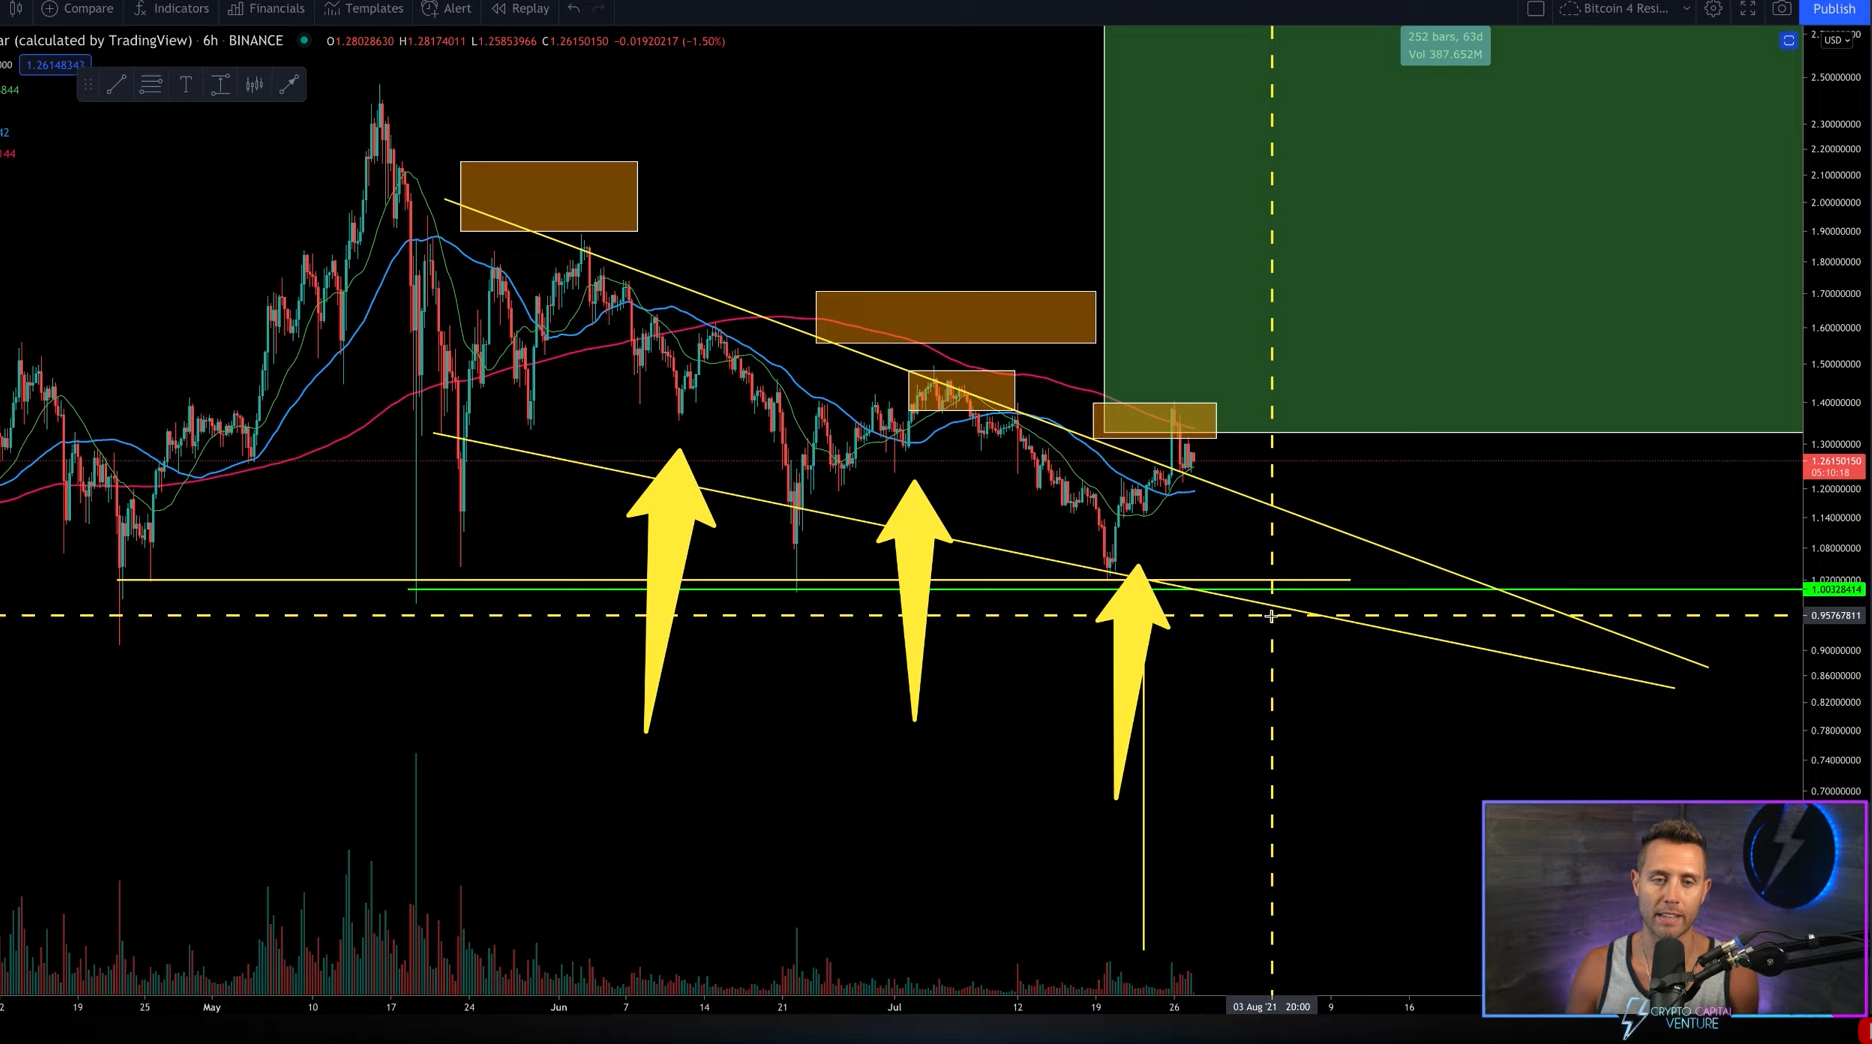
This would place the next critical resistance at $1.3-$1.4. Now, if these levels seem very close to you, then you should know why it won’t really be easy for ADA to breach them.

Cardano important levels | Source: Crypto Capital Venture
As Cardano failed to keep up with Bitcoin, it also failed to breach its own bull market door. ADA was already trading within a macro descending triangle and while it did eventually break out of it, at press time, it was again testing the upper trend line for support.
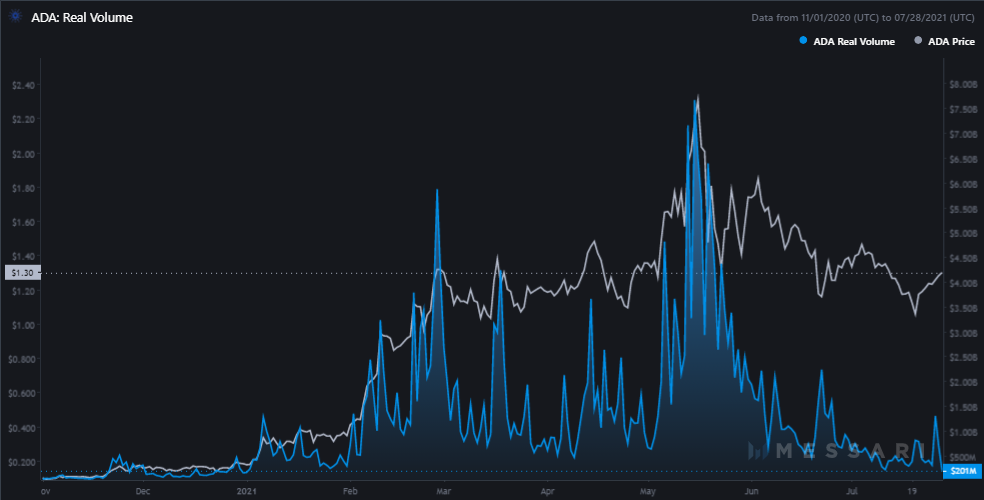
If it falls back into the structure, there’s no saying if it’ll be able to get out or not. While a mild correction would be considered normal, on-chain metrics painted a slightly different picture.

Cardano real volumes | Source: Messari – AMBCrypto
In fact, in spite of the aforementioned 22.4% hike, real volumes of the cryptocurrency have continued to fall. What’s more, the same was at levels last seen in November 2020.
With investor sentiment already on a consistent negative, this retracement makes sense. Should it continue to happen in the long term, critical support levels would be established around the $1.10-$1.16 range.


