Is the much-celebrated Bitcoin recovery going to be short-lived

Bitcoin, the market’s largest cryptocurrency, received a welcome price upswing last week. Investors’ faith in Bitcoin was restored as it traded above the $40k level quite a few times on 28, 29 and 30 July. However, even before market participants could savor these moments, the king coin’s price decided to throw another tantrum. BTC was back to the $38.5k level at press time.
Bitcoin‘s daily chart had witnessed successive green candles over the past week, but the candle under construction, while writing, was in red. In fact, Bitcoin’s price shed more than 3.1% in the past 24-hours alone. To further decipher the implications of the current chaotic state of Bitcoin, let’s look at a couple of prominent indicators.
Realized Value to Transaction & Network Value to Transaction
Both the RVT and the NVT ratios are akin to the basic Price to Earnings ratio. They compare the value flowing through the network to the relevant valuation. Whenever these ratios are used in tandem, they provide high conviction signals about the market’s state. High or increasing ratios imply decreasing relative demand and usually present themselves as a bearish fractal.
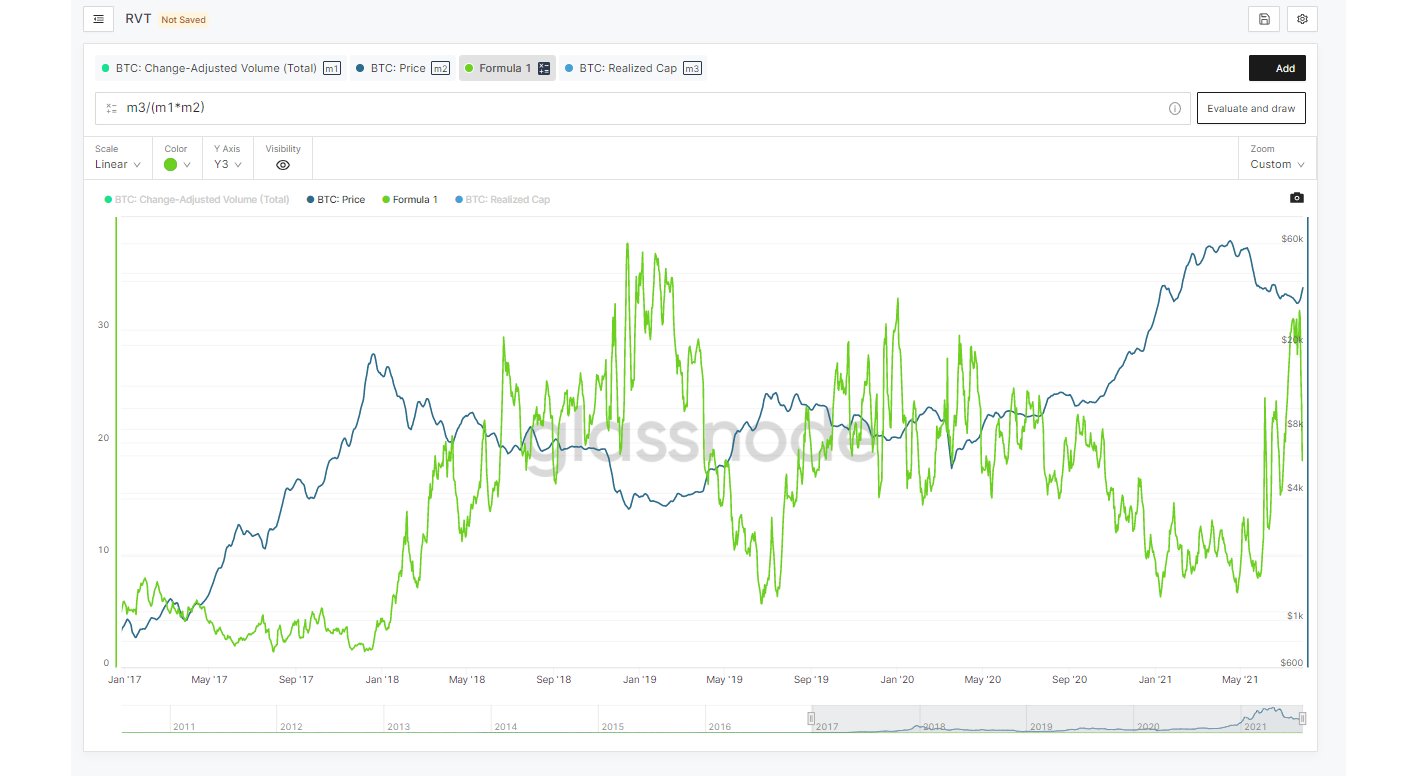
Both these ratios generally oscillate between 5 to 18 through bull markets in a sideways pattern. However, they end up breaking into a distinctive uptrend near the blow-off top. According to the NVT & RVT chart-readings, the recent uptick to $40k presented itself as a pretty short “weakening bull” run. The distinct uptrend witnessed on the RVT chart essentially stirs in a bearish sentiment.
Now even though the NVT dropped as low as 16 on 28 July, it stood at 33 at the time of writing. In fact, the curve further seemed to be heading north, again a typical bearish sign. Notably, during previous bull runs, both the NVT and RVT have spent more time on the downside. Hence, for the Bitcoin’s price to rise, these ratios need to take a step back.
Entities to the rescue?
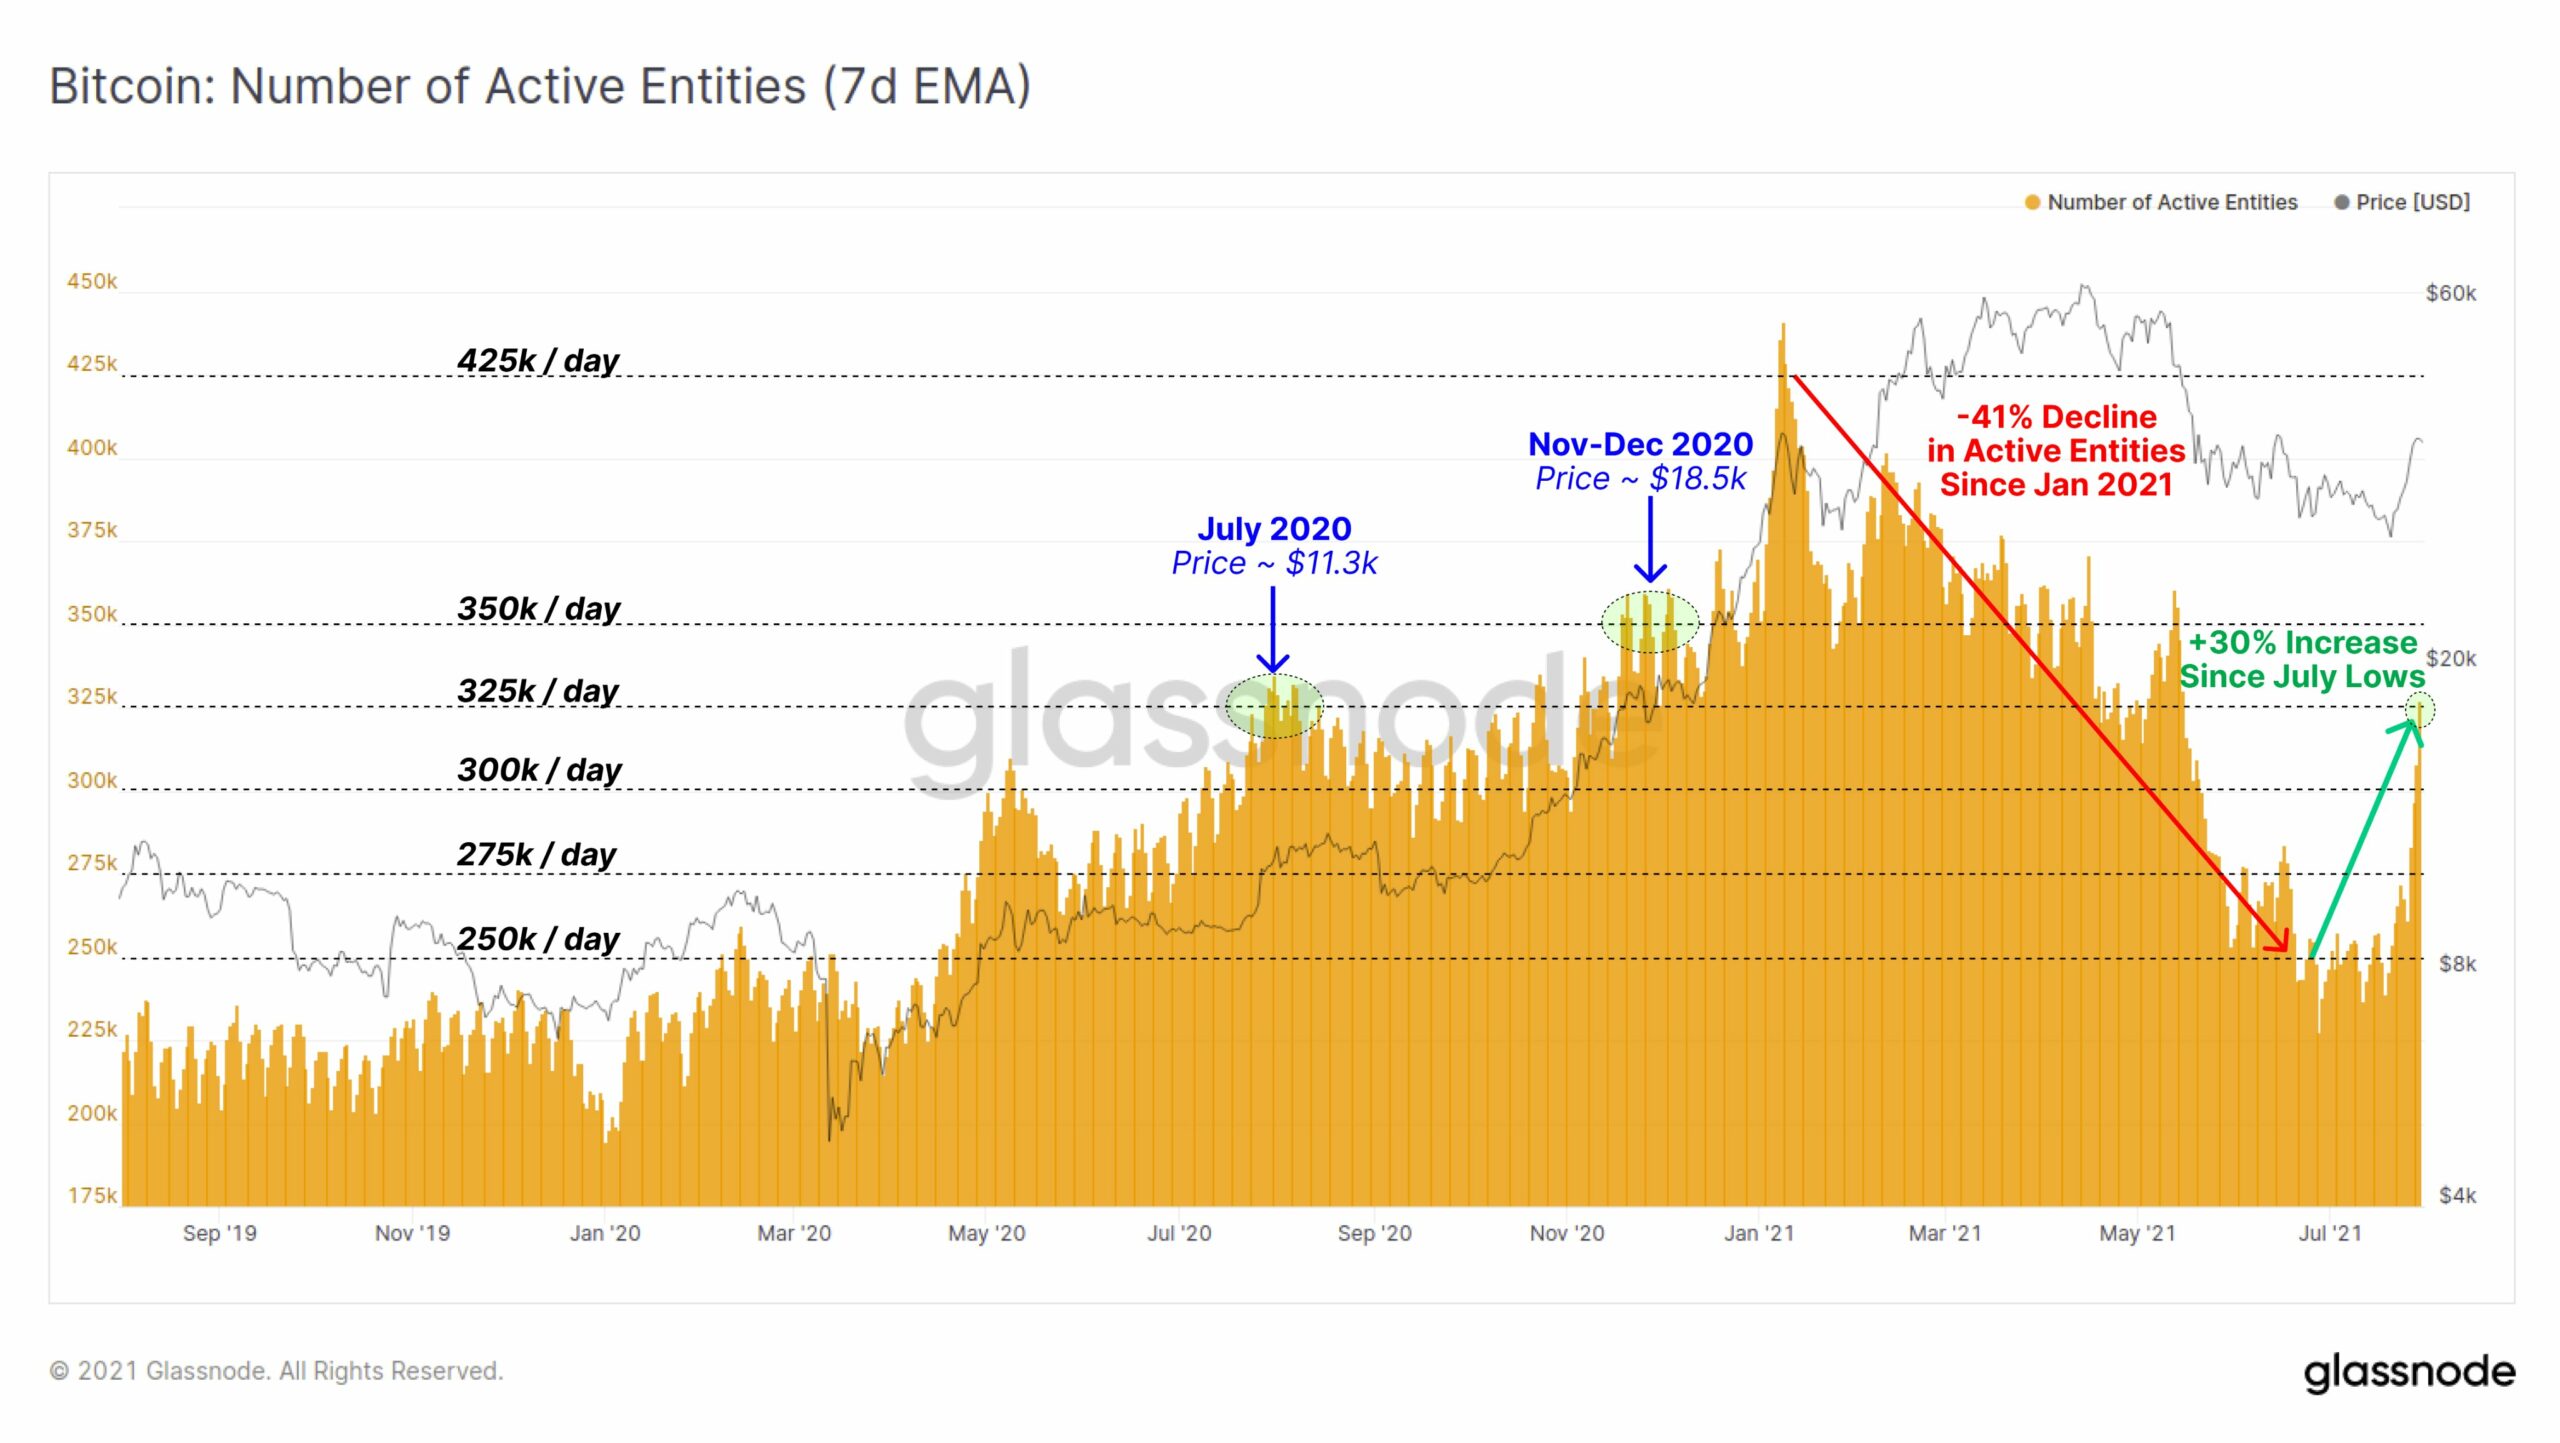
Now for the ratios to witness a change in trend, the relative demand needs to increase. As a matter of fact, Bitcoin has seen a resurgence in the number of active entities over the past week. The same has risen by 30% from 250k to 325 entities. As can be seen from the chart attached, the aforementioned level of activity was previously witnessed in July 2020 when Bitcoin’s price was around $11.3k.
At that stage, Bitcoin’s price consolidated for close to a month before witnessing a rally to $18.5k. If the tradition were to be followed this time too, the king coin’s price would end up witnessing an intense rally only towards the end of August. In the mean time, demand needs to pick up.
Additionally, for the odds of a price uptick to intensify in the near-term, it is crucial for BTC’s weekly candle to close above $39k.