Dogecoin traders must be on the lookout for this

Dogecoin’s close above $0.280 was a much needed change in the market as the alt managed to reclaim levels that were lost on the back of a descending triangle breakdown. However, the bearish response was quick to follow and it looked like DOGE was ready to concede hard fought ground.
A few areas could provide defensive measures but the threat of another sell-off loomed large. At the time of writing, Dogecoin traded at $0.297 and held the seventh spot in the crypto rankings.
Dogecoin 4-hour chart

Source: DOGE/USD, TradingView
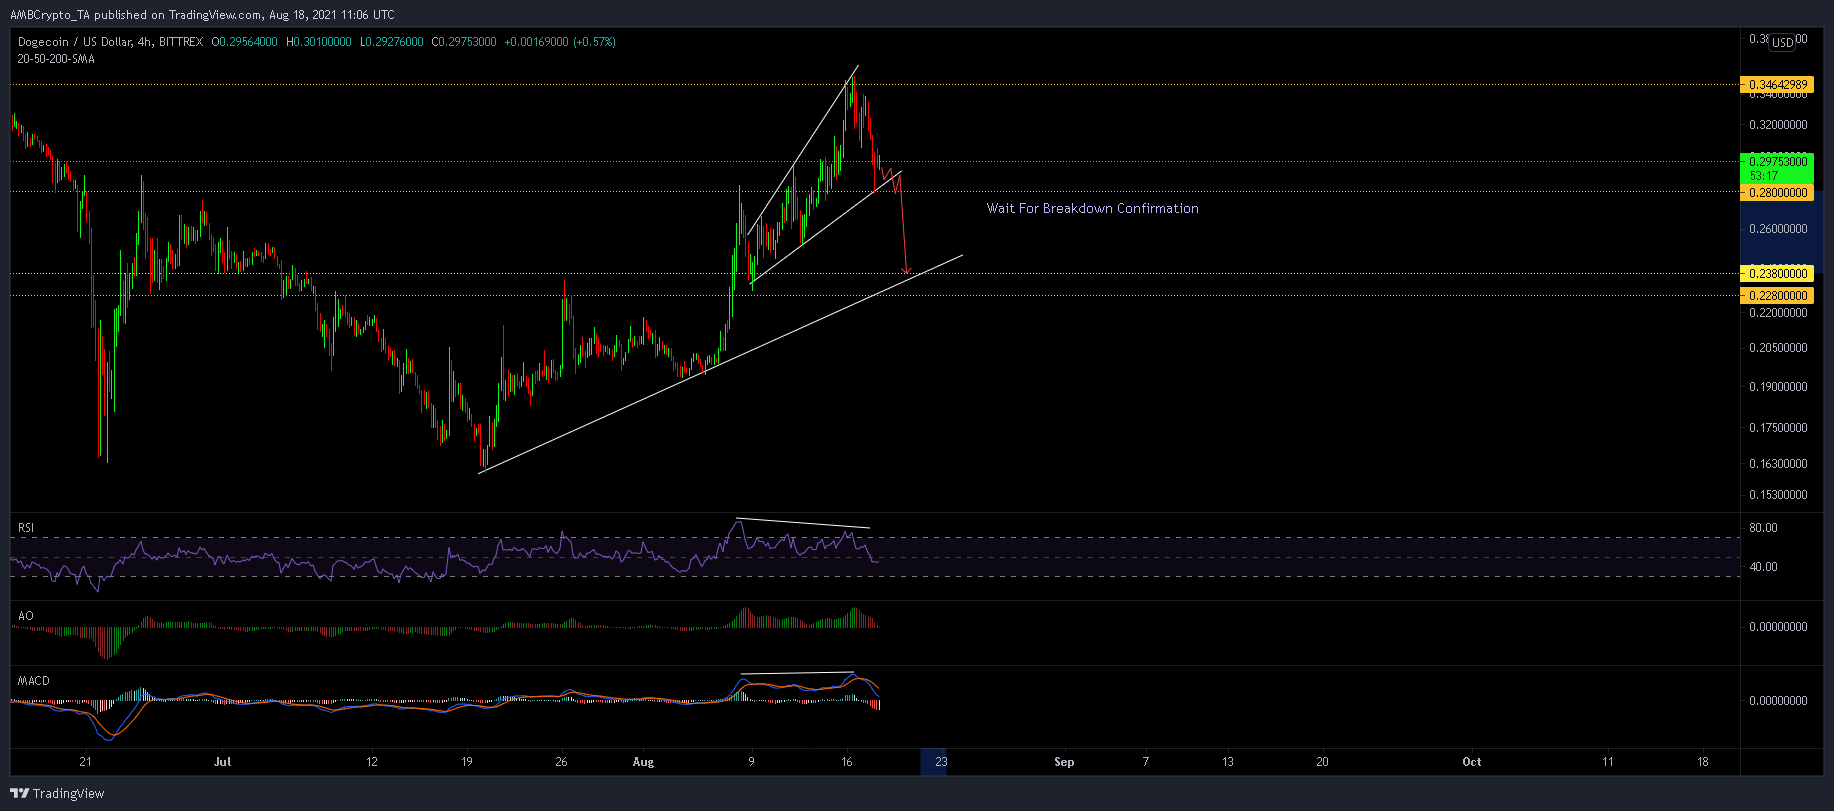
DOGE’s broadening wedge pattern emerged post its rally and subsequent retracement to a support zone of $0.228-$0.238. At press time, DOGE tested the lower trendline and threatened to break south from the pattern, but bulls put up a fight on the hourly chart and 4-hour 50-SMA (yellow).
If buyers fail to overturn the market in their favor, DOGE would head back towards $0.280, from where the market would remain vulnerable to a sharp decline . A worst-case outcome would see DOGE register another 15% plummet back to its support area of $0.228-$0.238. To negate this outcome, buyers would need to target a close above 12th August swing high of $0.294.
Reasoning
There were multiple warnings signs spread out on DOGE’s indicators but bulls seemed to keep their head above water. RSI lined up a bearish divergence but was yet to drop completely into bearish territory. Similarly, MACD and Awesome Oscillator registered a series of red bars but just managed to keep above their respective half-lines.
A clear sell signal would be presented once RSI dips below 40, while the MACD and AO fall below their equilibrium points as a result of selling pressure.
Conclusion
Dogecoin threatened to negate most of its progress made in the past week if prices break south from the broadening wedge. In such a case, traders can wait for a breakdown confirmation and short DOGE once prices retest $0.280 and fail to close at higher levels.


