Binance Coin, AAVE, Decred Price Analysis: 23 September

The likes of Binance Coin, AAVE, and Decred all gained on their respective charts over the last 24 hours. BNB saw a considerable 7% hike in its price as it moved near its one-week high. AAVE’s recovery led it to appreciate by 6.2% over the last 24 hours. Finally, Decred logged gains of 5.9% and was trading close to its immediate resistance.
Binance Coin [BNB]
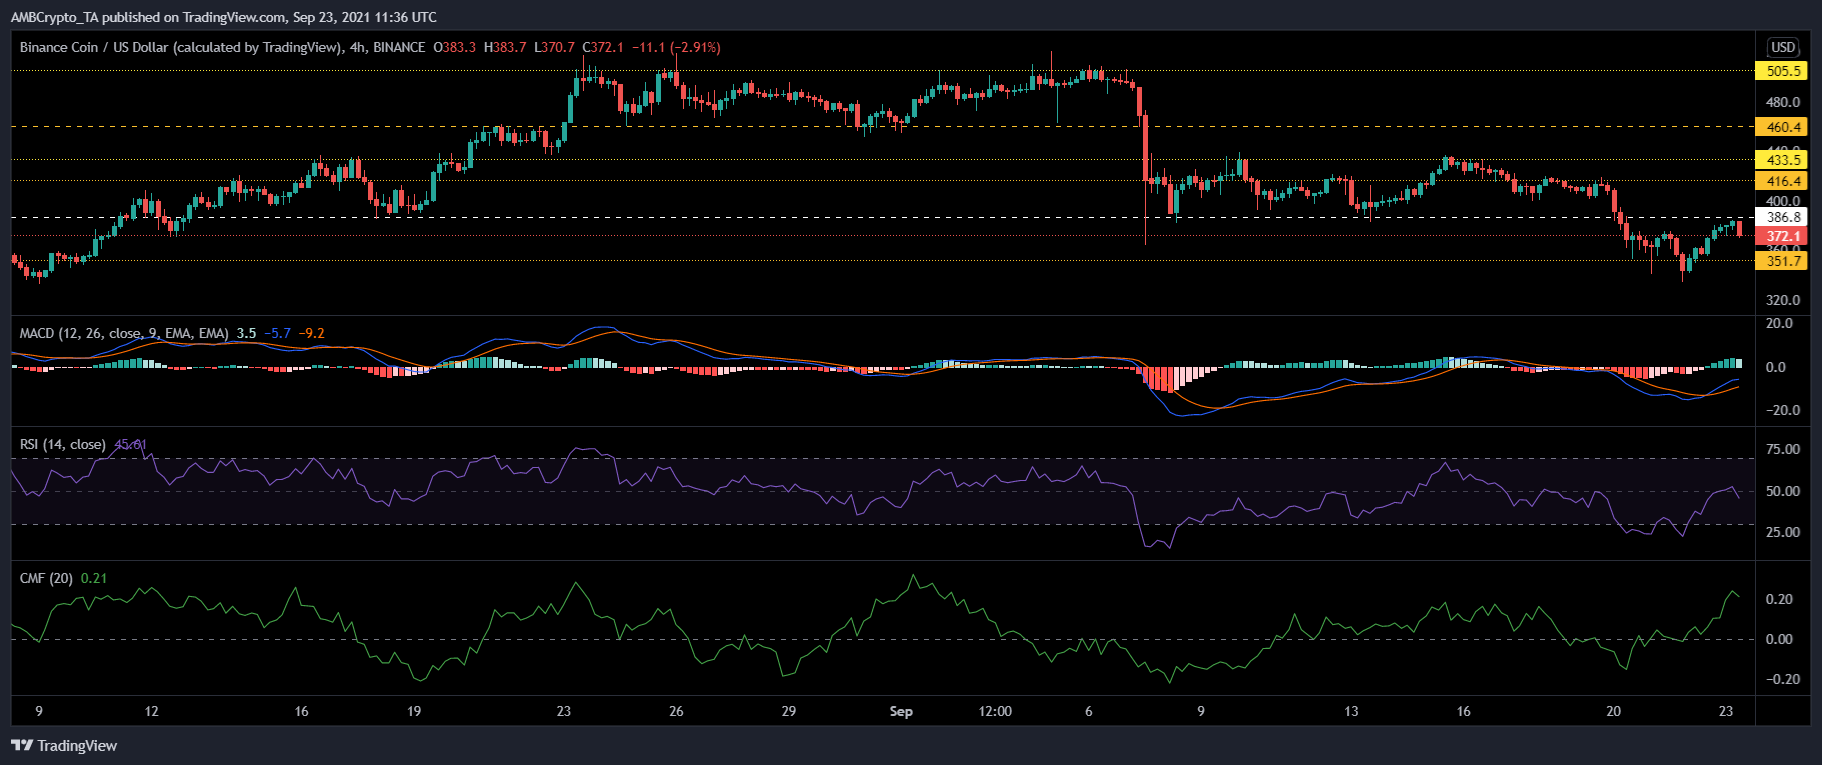
Binance Coin hiked by 7% over the last 24 hours and was trading at $372.1. Overhead resistance stood at $386.8. The other price ceilings stood at $416.4 and at the one-week high of $433.5.
The MACD underwent a bullish crossover and flashed green histograms. Chaikin Money Flow also stood above the half-line, indicating that capital inflows were positive. The Relative Strength Index, however, was in the bearish zone as it was positioned below the midline.
A sustained decline in buying pressure will drag the price further down. In case of such a situation, BNB could find itself trading at its nearest support level of $351.7.
AAVE

AAVE’s price appreciated over the last 24 hours. The immediate overhead resistance for the coin stood at $338.25. Other price ceilings awaited the coin at its one-week high of $375.40 and then at its multi-month high of $414.15.
Owing to the coin’s recovery, the price of AAVE just crossed above the four-hour 20-SMA. This reading suggested that price momentum was in favour of buyers. The MACD flashed green histograms. The Chaikin Money Flow pictured positive capital inflows. The Relative Strength Index, however, displayed declining buying pressure.
On the flip side, AAVE’s immediate support stood at $271.09.
Decred [DCR]
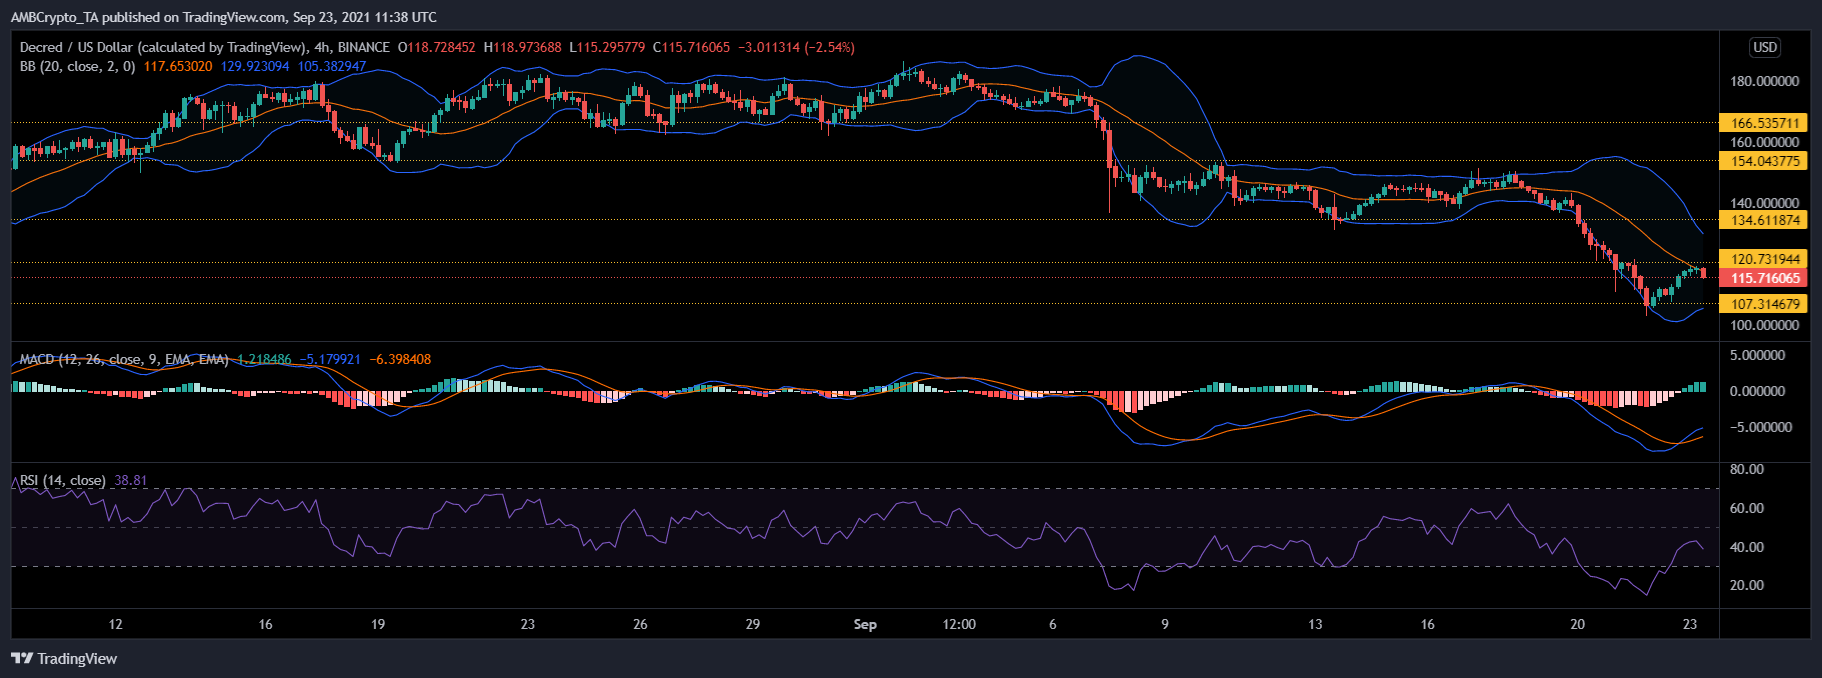
Decred also rose by 5.9% and was priced at $115.71. A move north could cause the altcoin to topple its immediate resistance of $120.73. If the altcoin manages to breach the $120.73-resistance, additional price ceilings awaited the coin at $134.61 and at its weekly high of $154.04.
Green histograms were visible on the MACD. This indicated that the price could see an uptrend. The Relative Strength Index still depicted revival from the recent sell-off as the indicator was parked below the half-line. The Bollinger Bands were converging at press time, a sign of low price volatility.
If selling pressure precedes buying pressure, the price of the altcoin could drop to the nearest price floor of $107.31.


