What Bitcoin needs to do before challenging $70,000

Disclaimer: The findings of the following analysis are the sole opinions of the writer and should not be considered investment advice
With Bitcoin now trading above its May ATH, the market is in anticipation of fresh milestones above the $67k-mark. The Fibonacci Extension tool can be used to plot BTC’s early-September drawdown from $53,000 to $40,000 to chart out potential targets going forward.
Before these targets are realized, however, it’s worth noting that a correction seemed to be developing off of an overbought RSI.
Hence, the focus would be on near-term support levels before BTC embarks on the next upswing towards $70,000. At the time of writing, BTC was trading close to its $65,000-levels.
Bitcoin Daily Chart
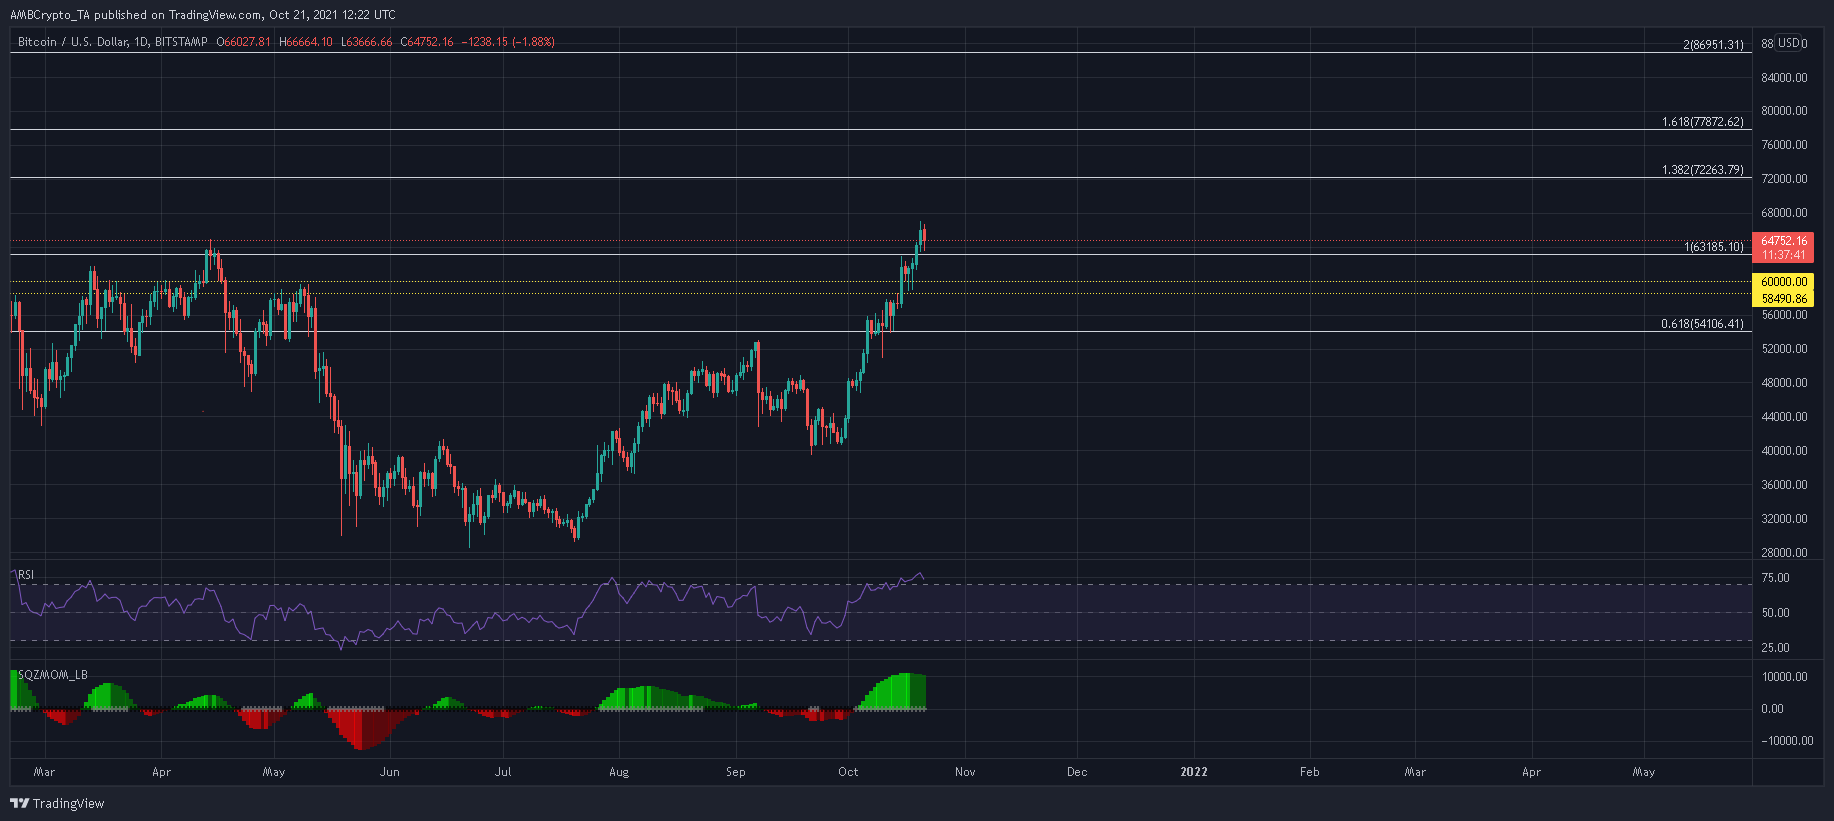
The 138.2% and 161.8% Fibonacci Extensions are BTC’s immediate destinations, while the 200% Extension around $80,000 is more of a long-term target. Now, BTC is out of the September curse and there is a host of bullish news backing the world’s largest digital asset. Thanks to all these updates, the remainder of Q4 can be expected to play in favor of the bulls.
However, before BTC does challenge these price levels, it’s crucial for a correction to kick in.
BTC, at press time, was trading at a 64% premium, when compared to its early-October levels. If Bitcoin continues to make more headway beyond $70k, selling pressure could be massive once a majority of investors lock in their gains and exit the market.
If a correction is observed immediately, the introduction of new longs would allow BTC to commence on a ‘healthy’ upcycle going forward.
Reasoning
Now, the daily RSI formed a single peak in the overbought territory. Historically, the RSI has touched the upper zone on several occasions during previous BTC bull runs, before reversals came in. For instance, BTC’s late-July rally saw the RSI snap six peaks above 70 before moving to the downside.
Meanwhile, the Squeeze Momentum Indicator has been gradually receding. Alas, BTC is known to surmount more value during such a phase as well. The rally would be threatened only if the SMI slips below its half-line and invites short-selling in the market.
Conclusion
Bitcoin could cool down to $63,000 or even $60,000 over the coming days, before challenging $70k. However, BTC’s overall bull run would remain intact until some bearish divergences begin to crop up on the RSI.
Once they do, BTC could trim its losses at $55,000 and $54,000, before the next upcycle.


![Stacks [STX] crashes to $0.13 even as PoX-5 testnet goes live – Why?](https://ambcrypto.com/wp-content/uploads/2026/07/IMG-20260725-WA0006.jpg)