Ethereum, Shiba Inu, Avalanche Price Analysis: 22 October

Cryptocurrency prices plunged today as Bitcoin declined from the all-time high it hit two days ago. Some altcoins like ETH, SHIB were trading with cuts over the last 24 hours while AVAX appeared to be in for a bull run.
Ether traded as high as $4,373, before it started correcting. AVAX saw continuing bullish momentum while Shiba Inu noted bearish signs in the near term.
Ethereum [ETH]
ETH registered a 1.44% fall over the last 24 hours and was trading at $4116.53, at press time. This price was well above its immediate support level that stood at $3641.56. The 4-hour chart depicted a bullish trendline, affirming the bullish price action in recent times. However, key technicals pointed towards decreasing buying strength.
The Relative Strength Index (RSI) was skewed in favor of buyers and was at 61.09. The RSI took a dip from 76.70 to 61.09 over the last 24 hours, highlighting a fall in buying pressure. However, the RSI trendline seemed to favor the buyers in the near term.
The MACD and Signal line converged, with the MACD line looking to head south. The green bars of the MACD histogram approached the zero line, confirming low buying strength. Finally, the Average Directional Index stood at 36.54, indicating a strong directional trend.
Shiba Inu [SHIB]
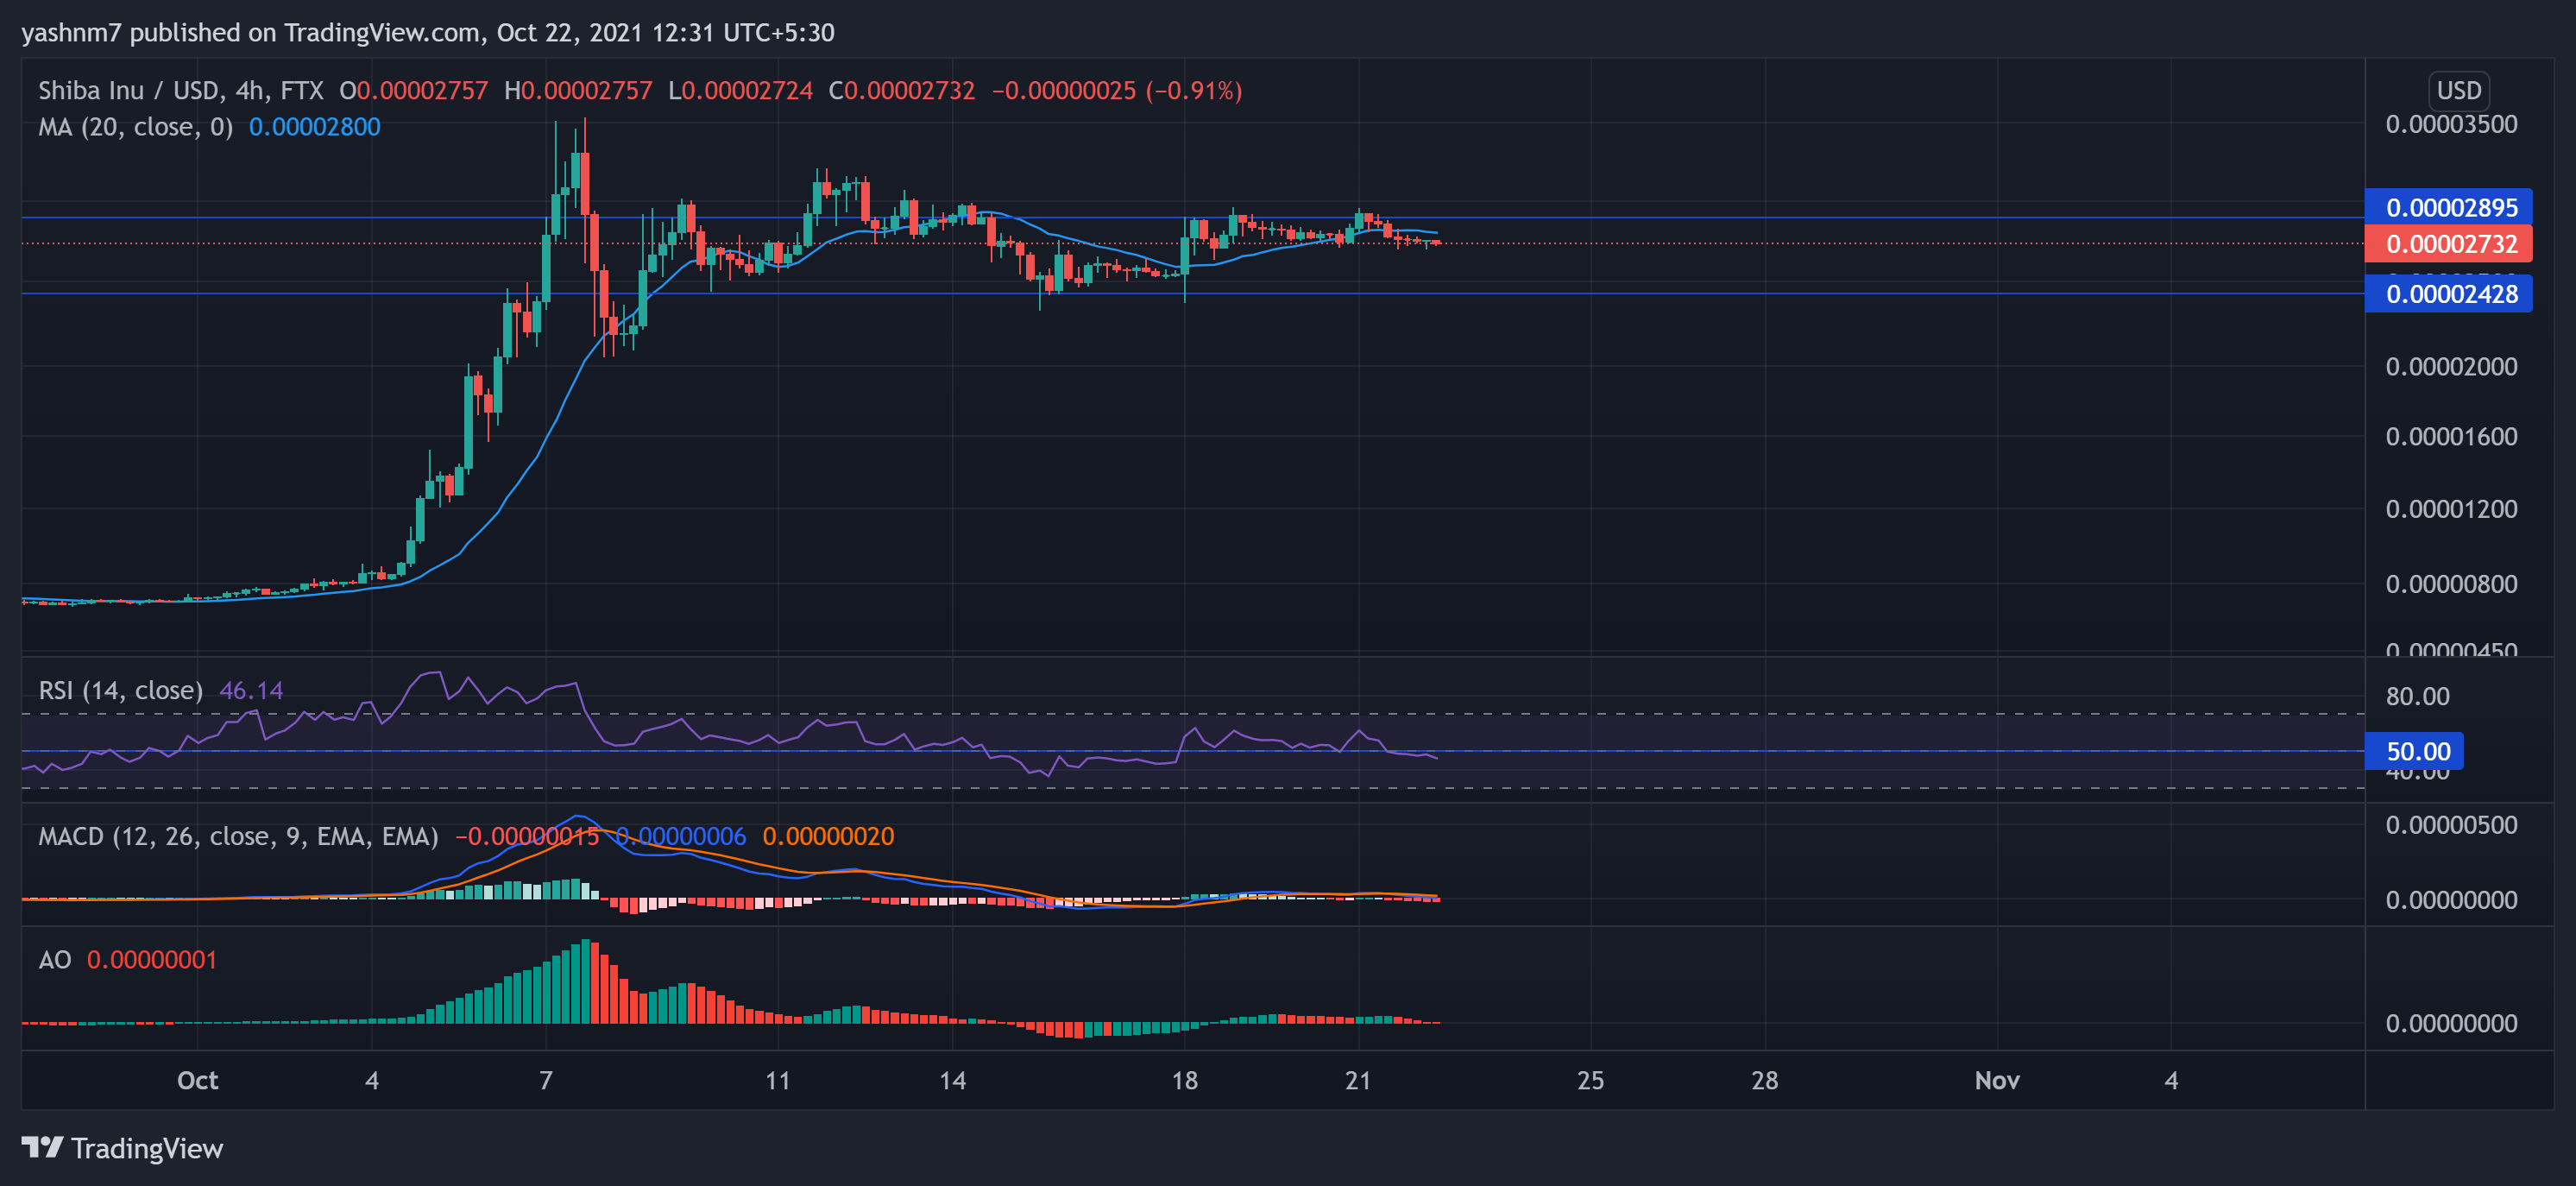
SHIB’s price fell by 4.12% over the last 24 hours and was trading at $00.00002732. The price could not breach its immediate resistance, which stood at $0.00002895 and later assumed consolidation. The support level stood at $0.00002428. The trading price was below the 20-SMA level and thus, displayed sellers’ dominance.
The RSI was on a downslide and plunged below the midline, visibly depicting the preference for the bears. The MACD (blue) was below the Signal Line (orange), confirming the power of the sellers. The MACD Histogram and the Awesome Oscillator agreed and hinted at bearish tendencies.
Avalanche [AVAX]
AVAX surged by 6.02% in the last 24 hours. The altcoin breached its previous resistance that capped at $62.41 and was trading at $65.44 at the time of analysis. The new resistance level stood at $73.31. The trading price was near the upper band of the Bollinger bands, hinting at the superiority of the buying strength.
The RSI recorded a 15-point plunge over the last day and stood in the overbought territory at 72.09, indicating that the bulls had taken over. However, one cannot discard the possibility of a trend reversal.
The MACD histogram and the Awesome Oscillator confirmed the previous readings by flashing green signal bars.


