Shiba Inu, Bitcoin Cash, Uniswap Price Analysis: 28 October

While the cryptocurrency market showed some signs of revival over the last day, Shiba Inu yet again skyrocketed to create a new ATH. However, altcoins like Bitcoin Cash and Uniswap continue to display a gradual decline on their charts.
Shiba Inu (SHIB)
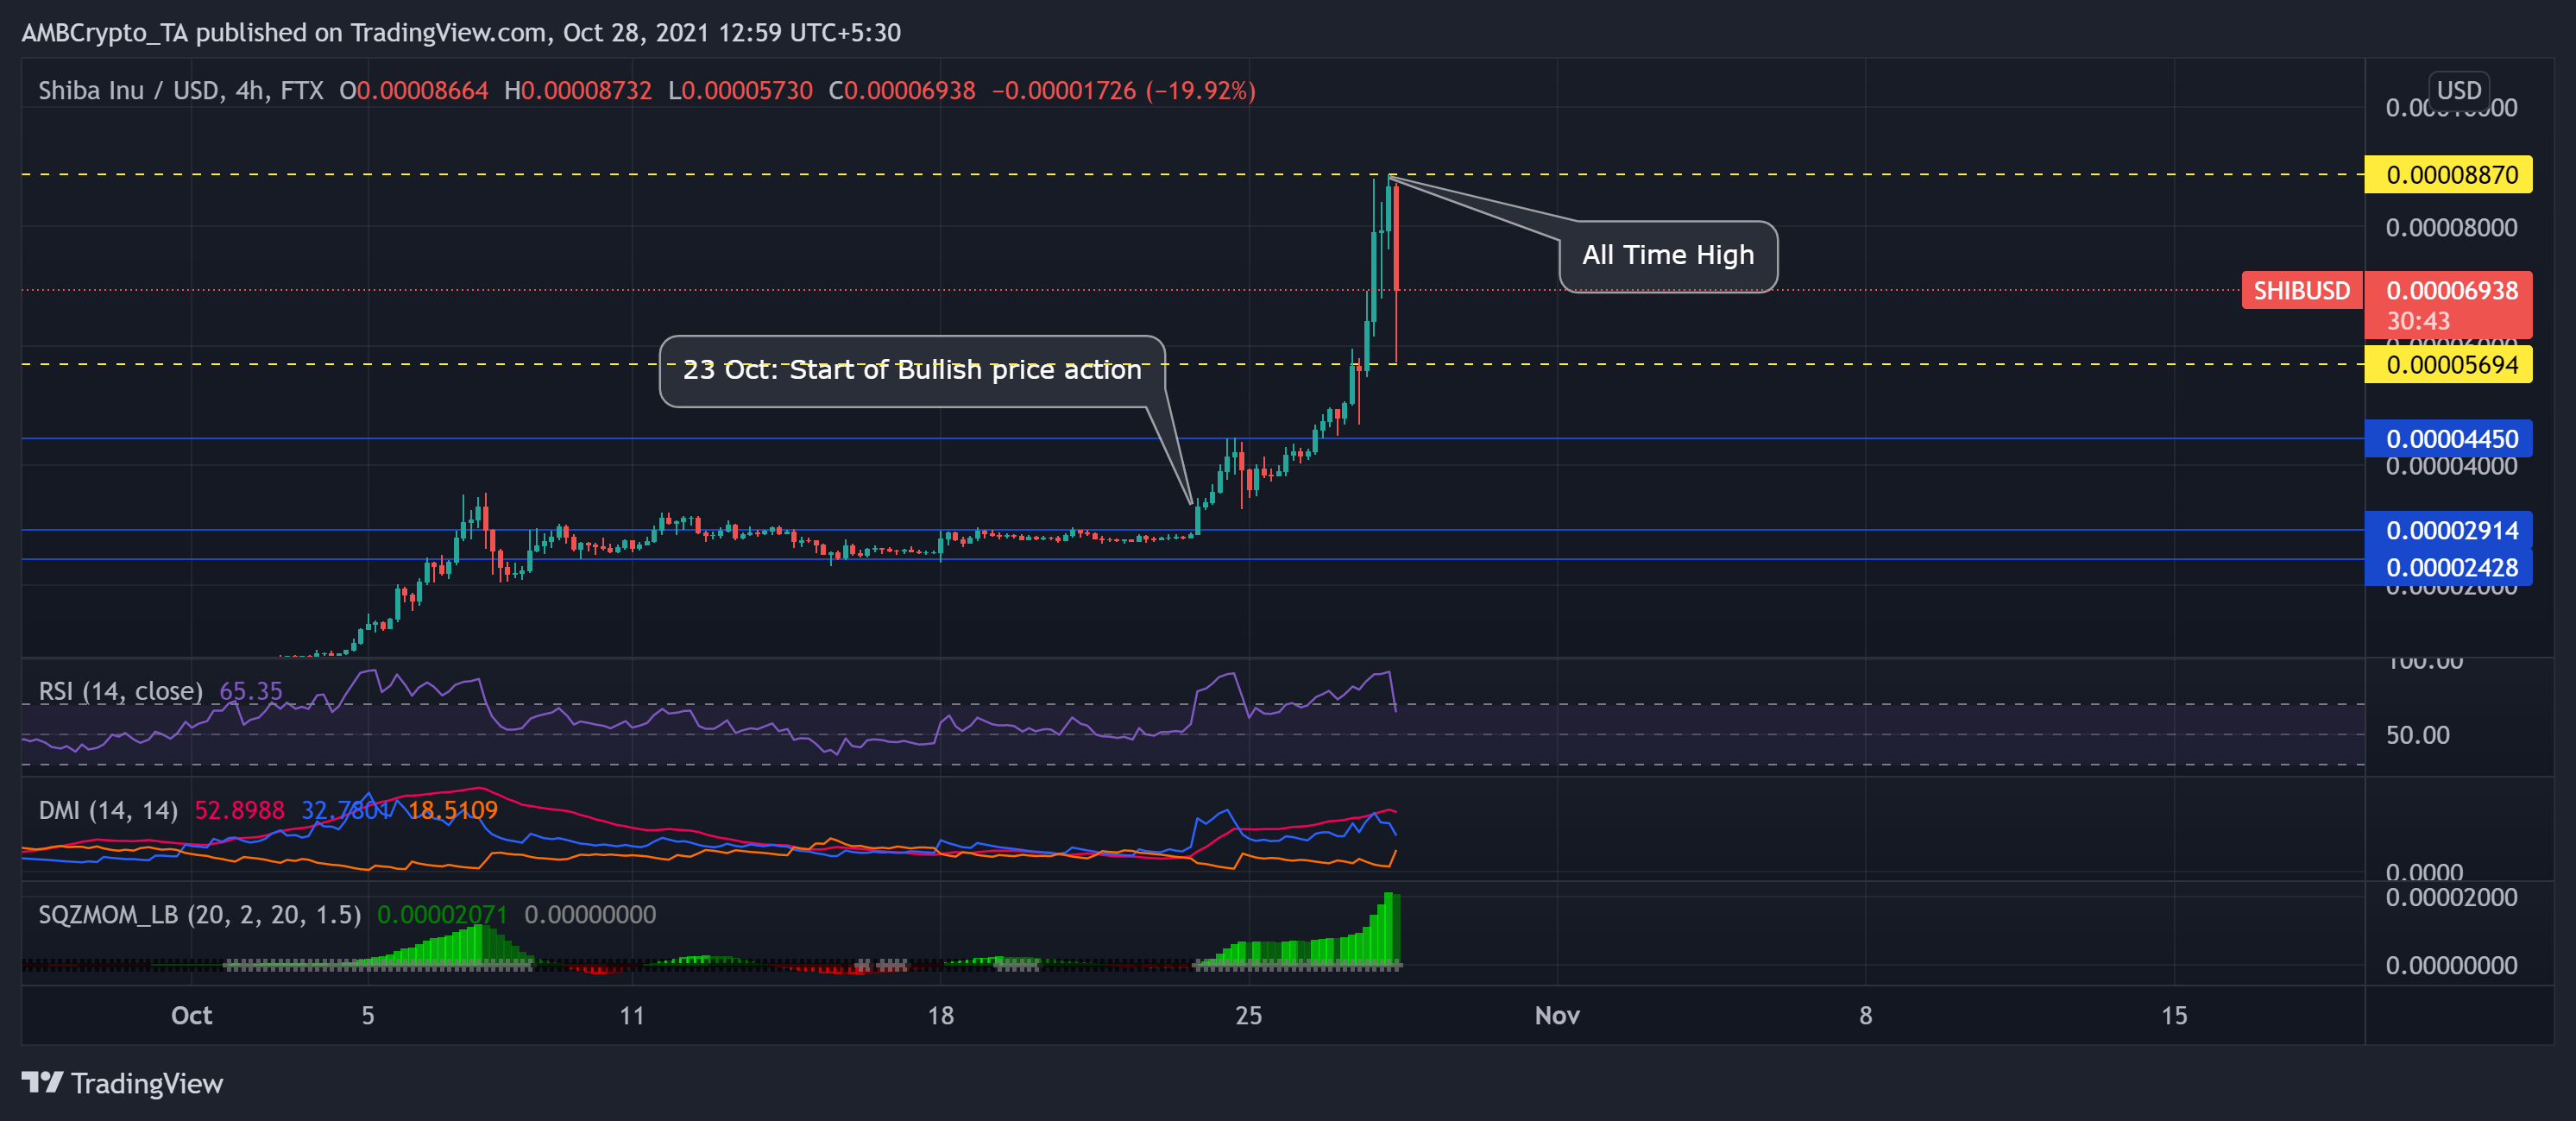
SHIB created a new ATH at $0.0000887 and witnessed an unrivaled growth of 140% over the past week. The meme token undertook a bullish price action from 23 October after it got listed on multiple exchanges. At press time, nearly 380,000 people have signed a petition for listing SHIB on Robinhood.
The bullish price trajectory reflects the market sentiment, as SHIB expanded into the DeFi ecosystem and launched its ‘Shiboshi’ NFT collection. The token was trading at $0.00006938 and surged by over 20% in the last 24 hours. SHIB army found support at $0.00005694.
The RSI stood the 65-mark after falling from the overbought territory and showed signs of reversal. DMI depicted a superior buying power but pointed to a possible bearish divergence in the near term. Also, the ADX line (red) was at the 52-mark and indicated a powerful directional strength. Moreover, the Squeeze Momentum Indicator displayed a dark green bar and highlighted possible ease in bullish momentum.
Bitcoin Cash (BCH)
Since the altcoin hit its six-week high on 21 October, BCH bulls seemed to lose their vigor as the prices saw a correction. Bears exerted constant pressure as the bulls ensured support at the $548-mark. The digital currency traded at $566.9 and saw a nearly 7% decrease on its daily charts.
The RSI was near the oversold territory, depicting the superior selling strength. However, it seemed to head north. The MACD Histogram and Awesome oscillator (AO) were below the zero line indicating a preference for the sellers. Nevertheless, AO flashed green signal bars while the MACD histogram approached the half-line, possibly pointing at a upward momentum in the near term.
Uniswap (UNI)
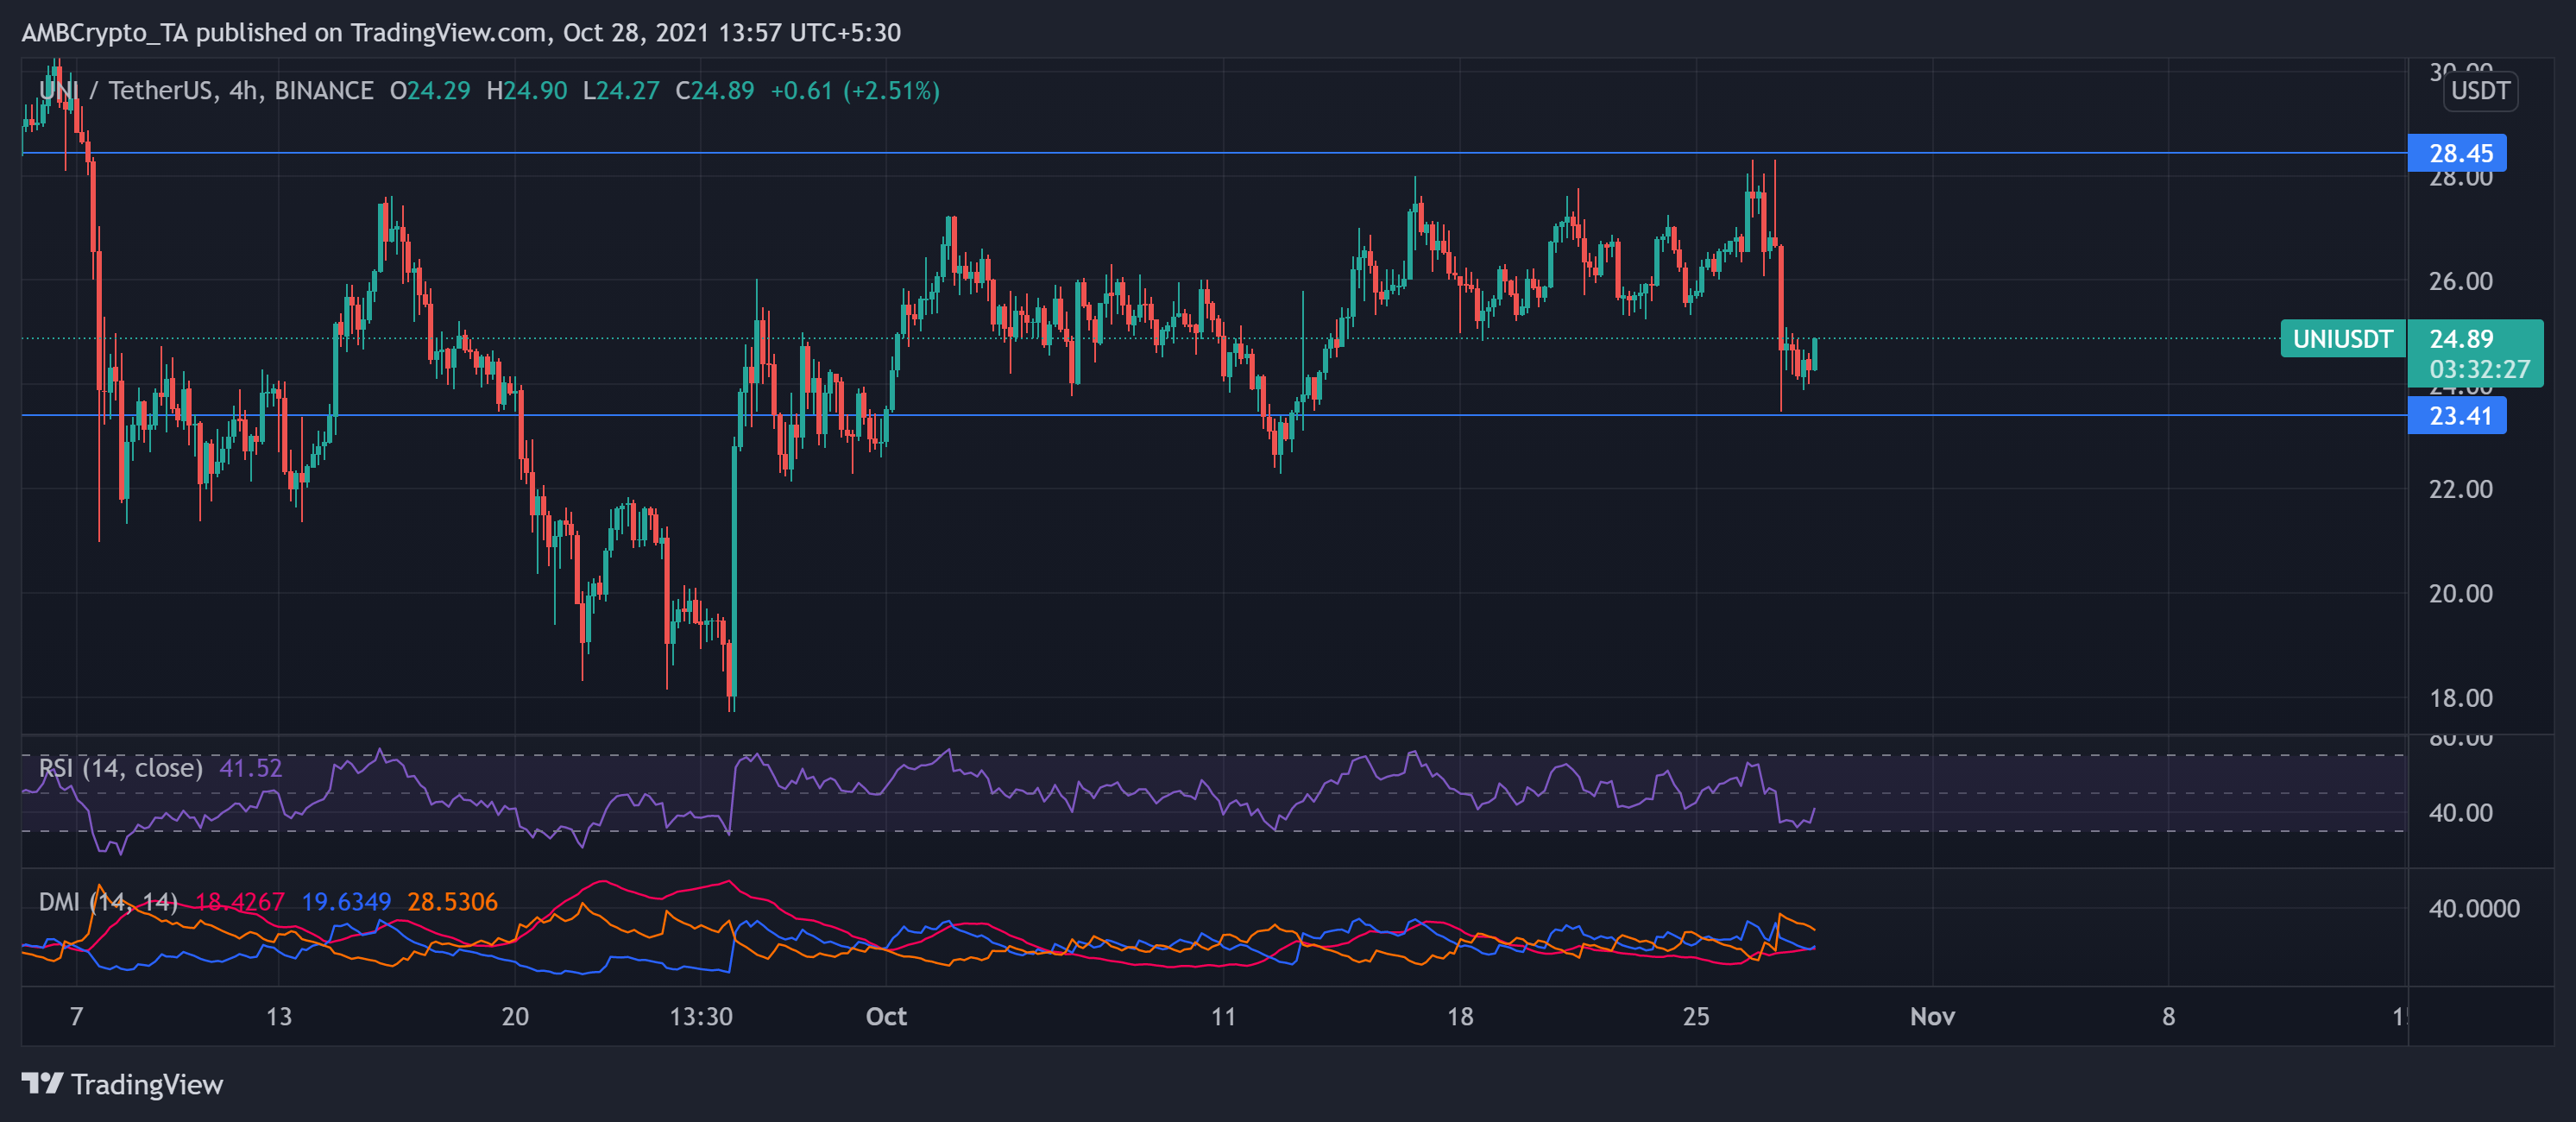
Over the past week, UNI oscillated within its immediate support and resistance that stood at $23.41 and $28.45, respectively. After touching its 51-day high on 27 October, the bears ensured consolidation by obeying the resistance point. UNI saw a pullback as it registered an 8% seven-day decrease and traded at $24.89 at press time.
The RSI was near the 40-mark and suggested a preference for sellers. However, it seemed to head north. Also, the MACD was below the Signal line and showed a preference for selling strength. Nevertheless, The ADX line displayed a weak directional trend.


