Polkadot, Binance Coin, Aave Price Analysis: 19 December

Polkadot saw an expected dropdown from the 20-SMA level while it continued to flash bearish technical indications. AAVE saw an uptrend and managed to form a reversal pattern on the 4-hour timeframe. Moreover, Binance Coin flashed mixed signs after forming a bearish flag.
Polkadot (DOT)
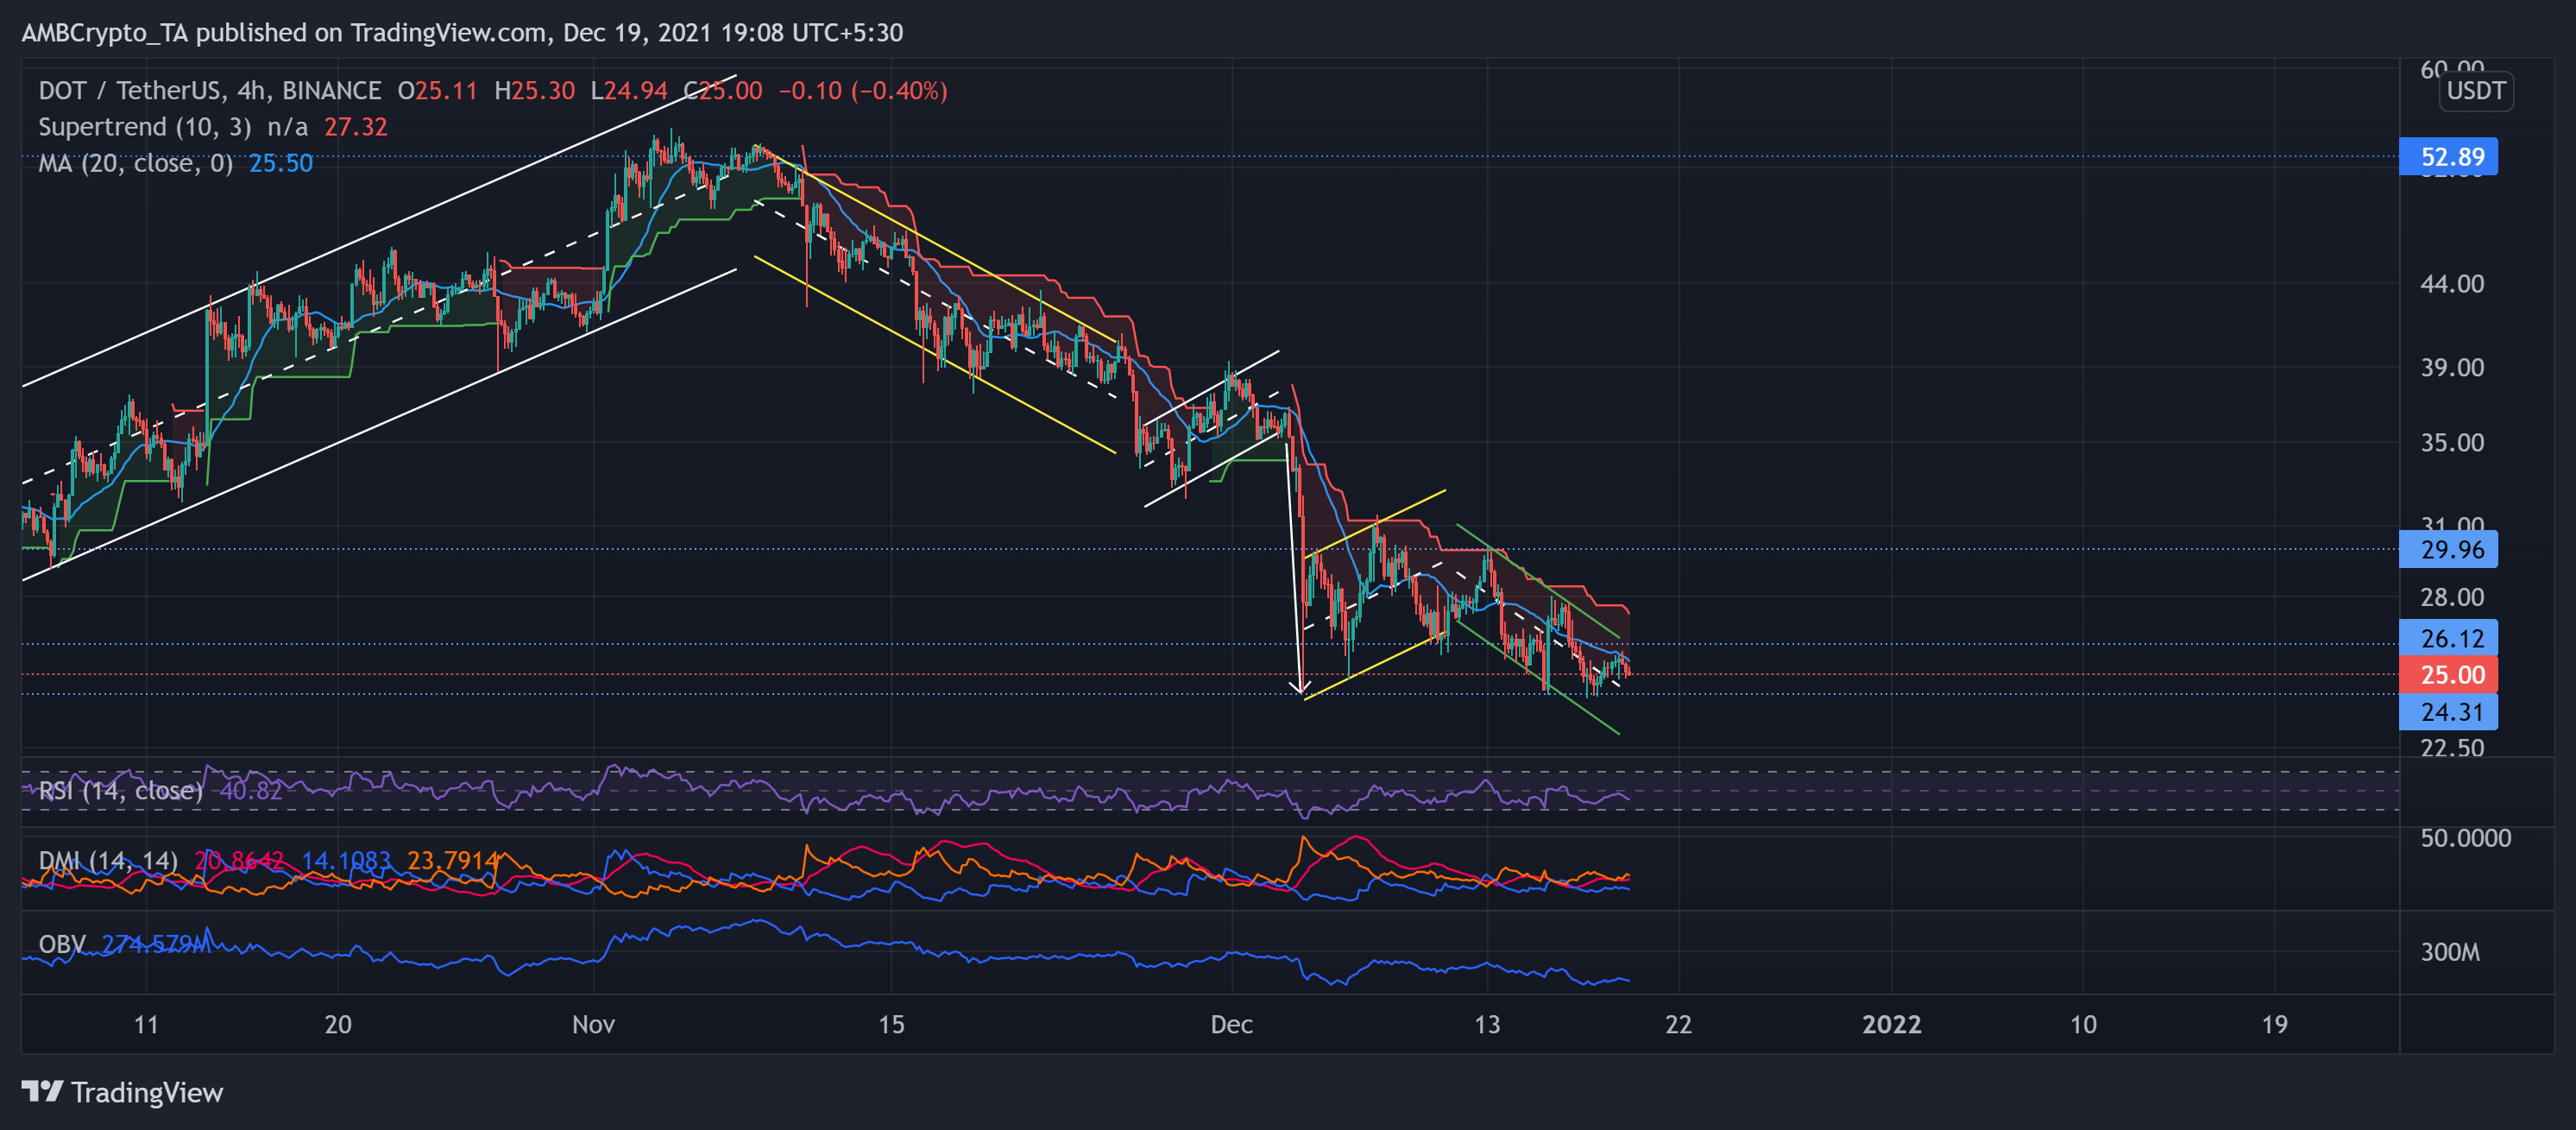
DOT bears over-retraced its previous bull run in an up-channel (white) as the token lost its 16-week previous support at the $26-mark. The alt was down by over 54% since its ATH on 4 November.
The digital currency refrained from halting its aggressive decline as the bears endeavor to test the $24.31 support for the fourth time in 15 days. Thus, the Supertrend mostly wavered in the red zone. As mentioned previously, the buyers retested the 20-SMA (blue) and saw a slight pullback. Also, the OBV marked lower highs and confirmed the slackening buying power.
At press time, the alt traded at $25. The RSI was southbound and showed no revival signs. Further, the DMI reaffirmed the bearish vigor, but the ADX displayed a weak directional trend for the token.
Binance Coin (BNB)
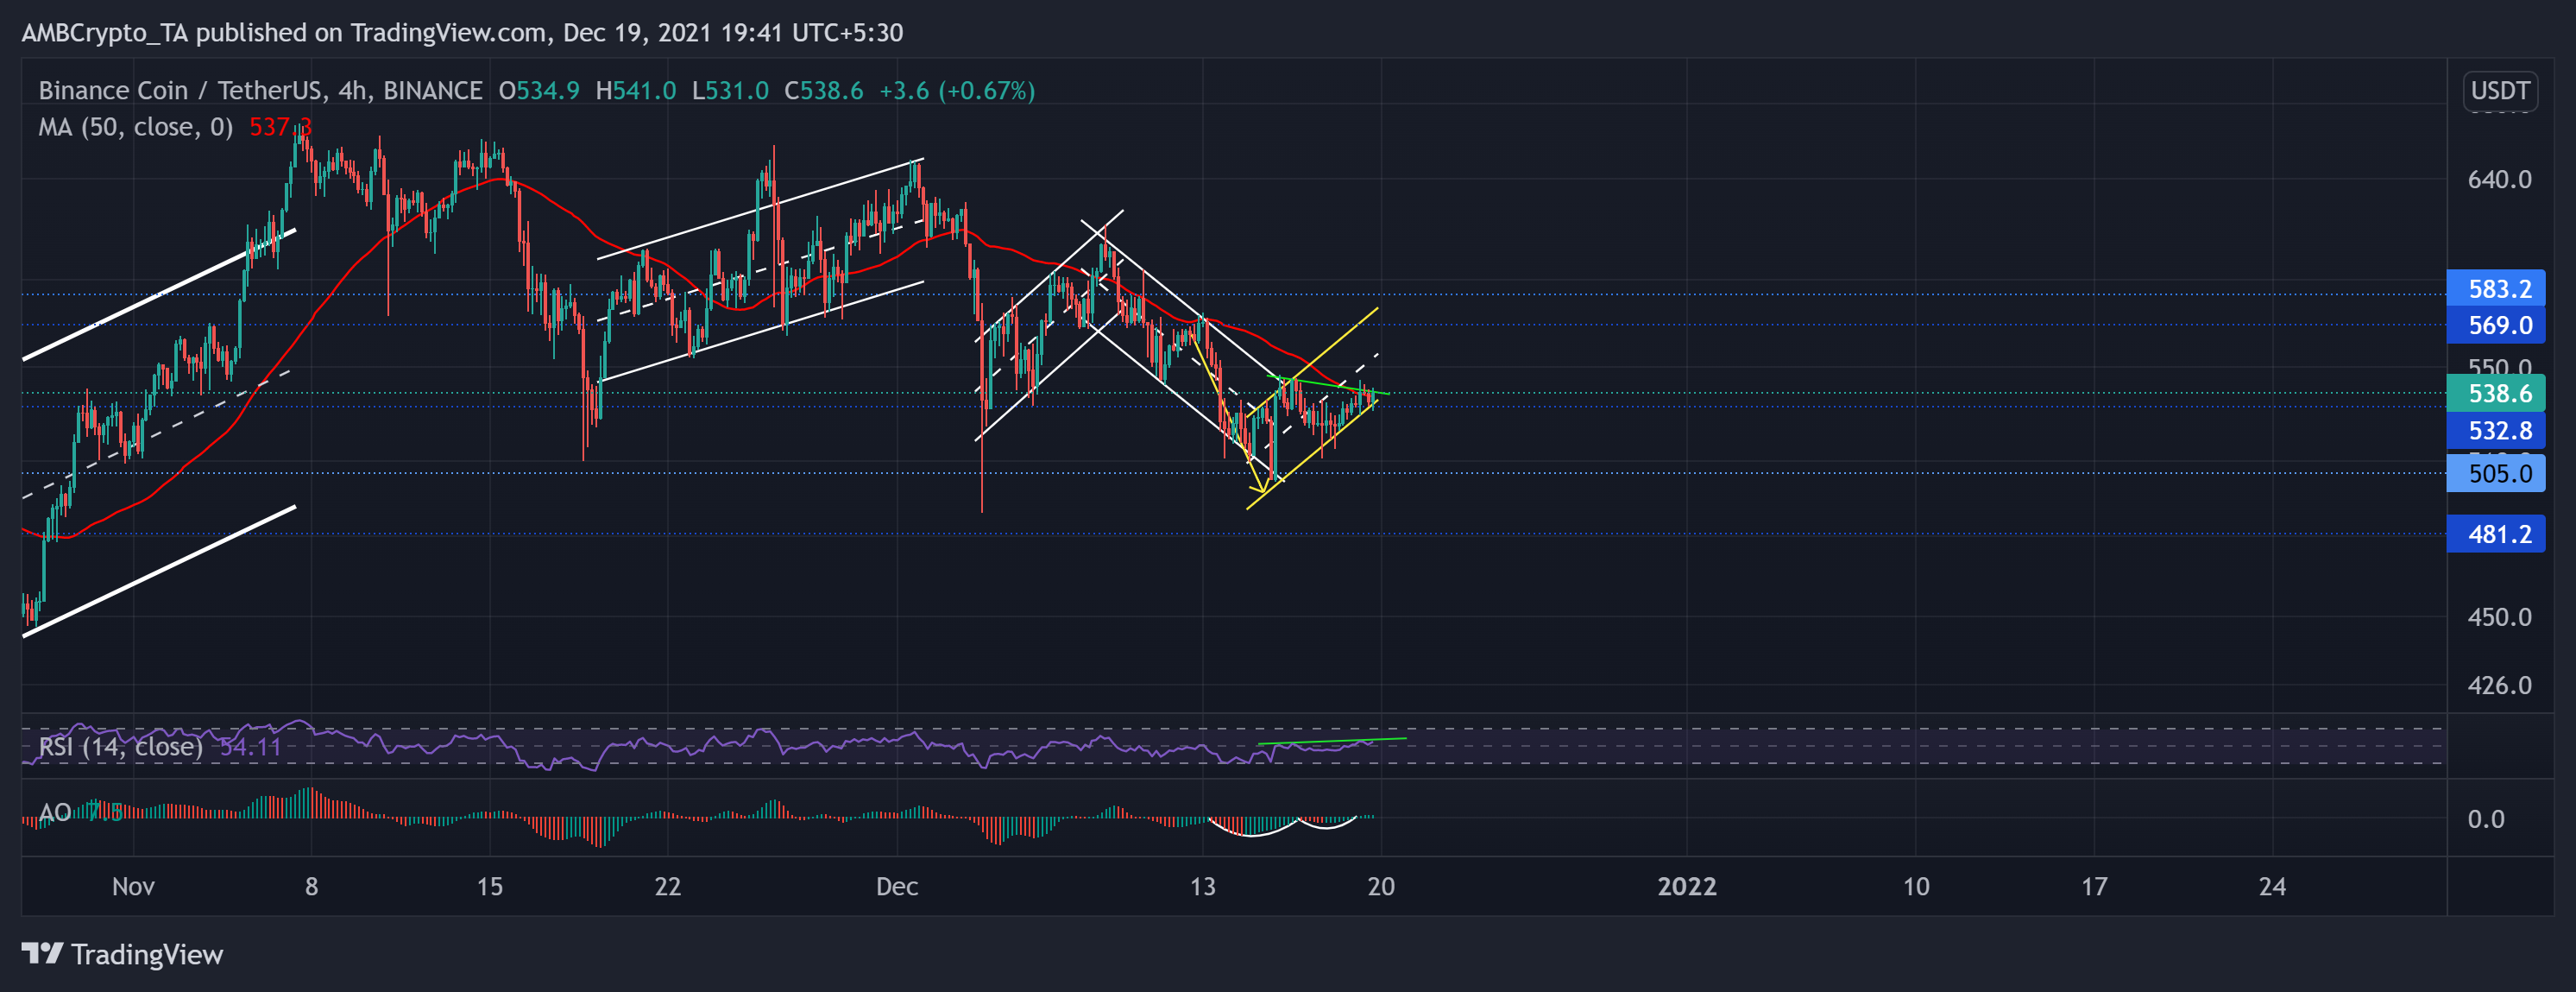
Over the past few days, BNB formed a bearish flag as the bulls attempted to retest the $532.8-mark.The price action price bounced back from the lower channel (yellow) but saw resistance at the 50-SMA (green).
However, a green candlestick on 19 December crossed the above mark and displayed increased bull pressure.
The bulls have ensured the $505-mark for seven weeks now. At press time, BNB traded at $538.6. The RSI stood at the 54-mark after preferring the bulls but formed a bearish divergence (green) with the price action. The AO saw an uptrend after forming bullish twin peaks below the equilibrium.
AAVE
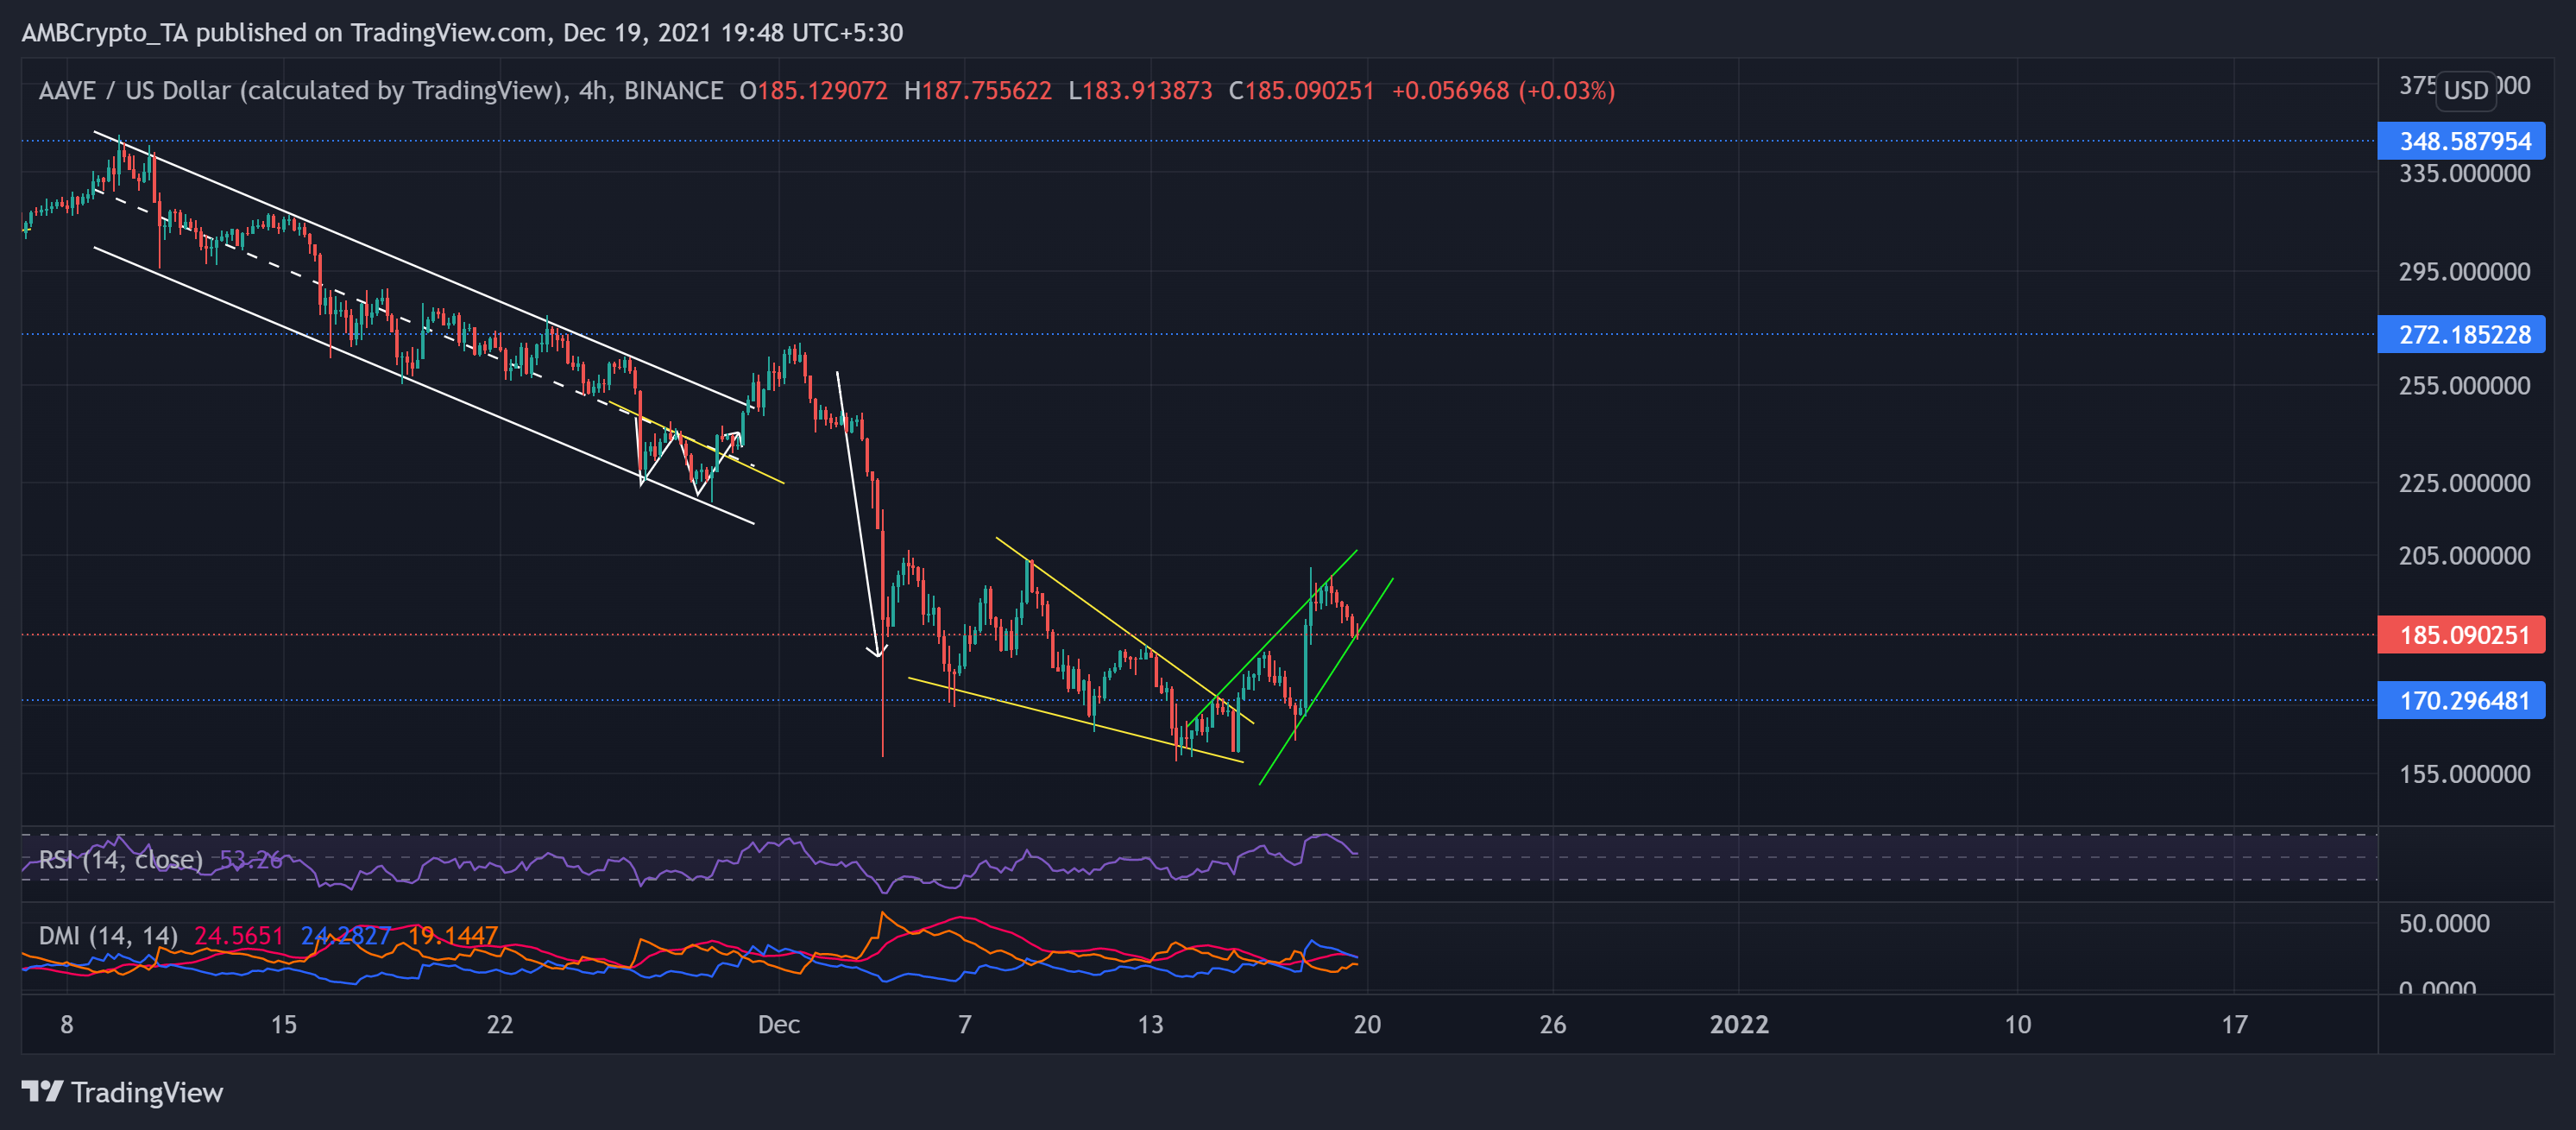
After forming a double-bottom in late November, the price action saw a break out of the channel but immediately saw a sharp pullback. AAVE saw a monstrous 46.9% 30-day decline and poked its record low on 13 December at $157.29.
As mentioned in the previous article, AAVE saw an expected falling wedge breakout on 15 December. Now, the alt yet again marked a reversal pattern by forming a rising wedge on its 4-hour chart.
At press time, AAVE traded at $185.09 after noting a 3.2% 24-hour loss. The RSI saw a steep plunge but managed to mark higher lows. Also, DMI flashed a slight bullish bias in the near term.


