Chainlink, Uniswap, Aave Price Analysis: 15 December

As the crypto market reached the $2.3T-mark, altcoins like Chainlink and Uniswap failed to uphold their multi-month-long resistance levels. These cryptos saw a swift decline after a rising wedge breakout.
On the other hand, AAVE marked a falling wedge while flashing mixed signs.
Chainlink (LINK)
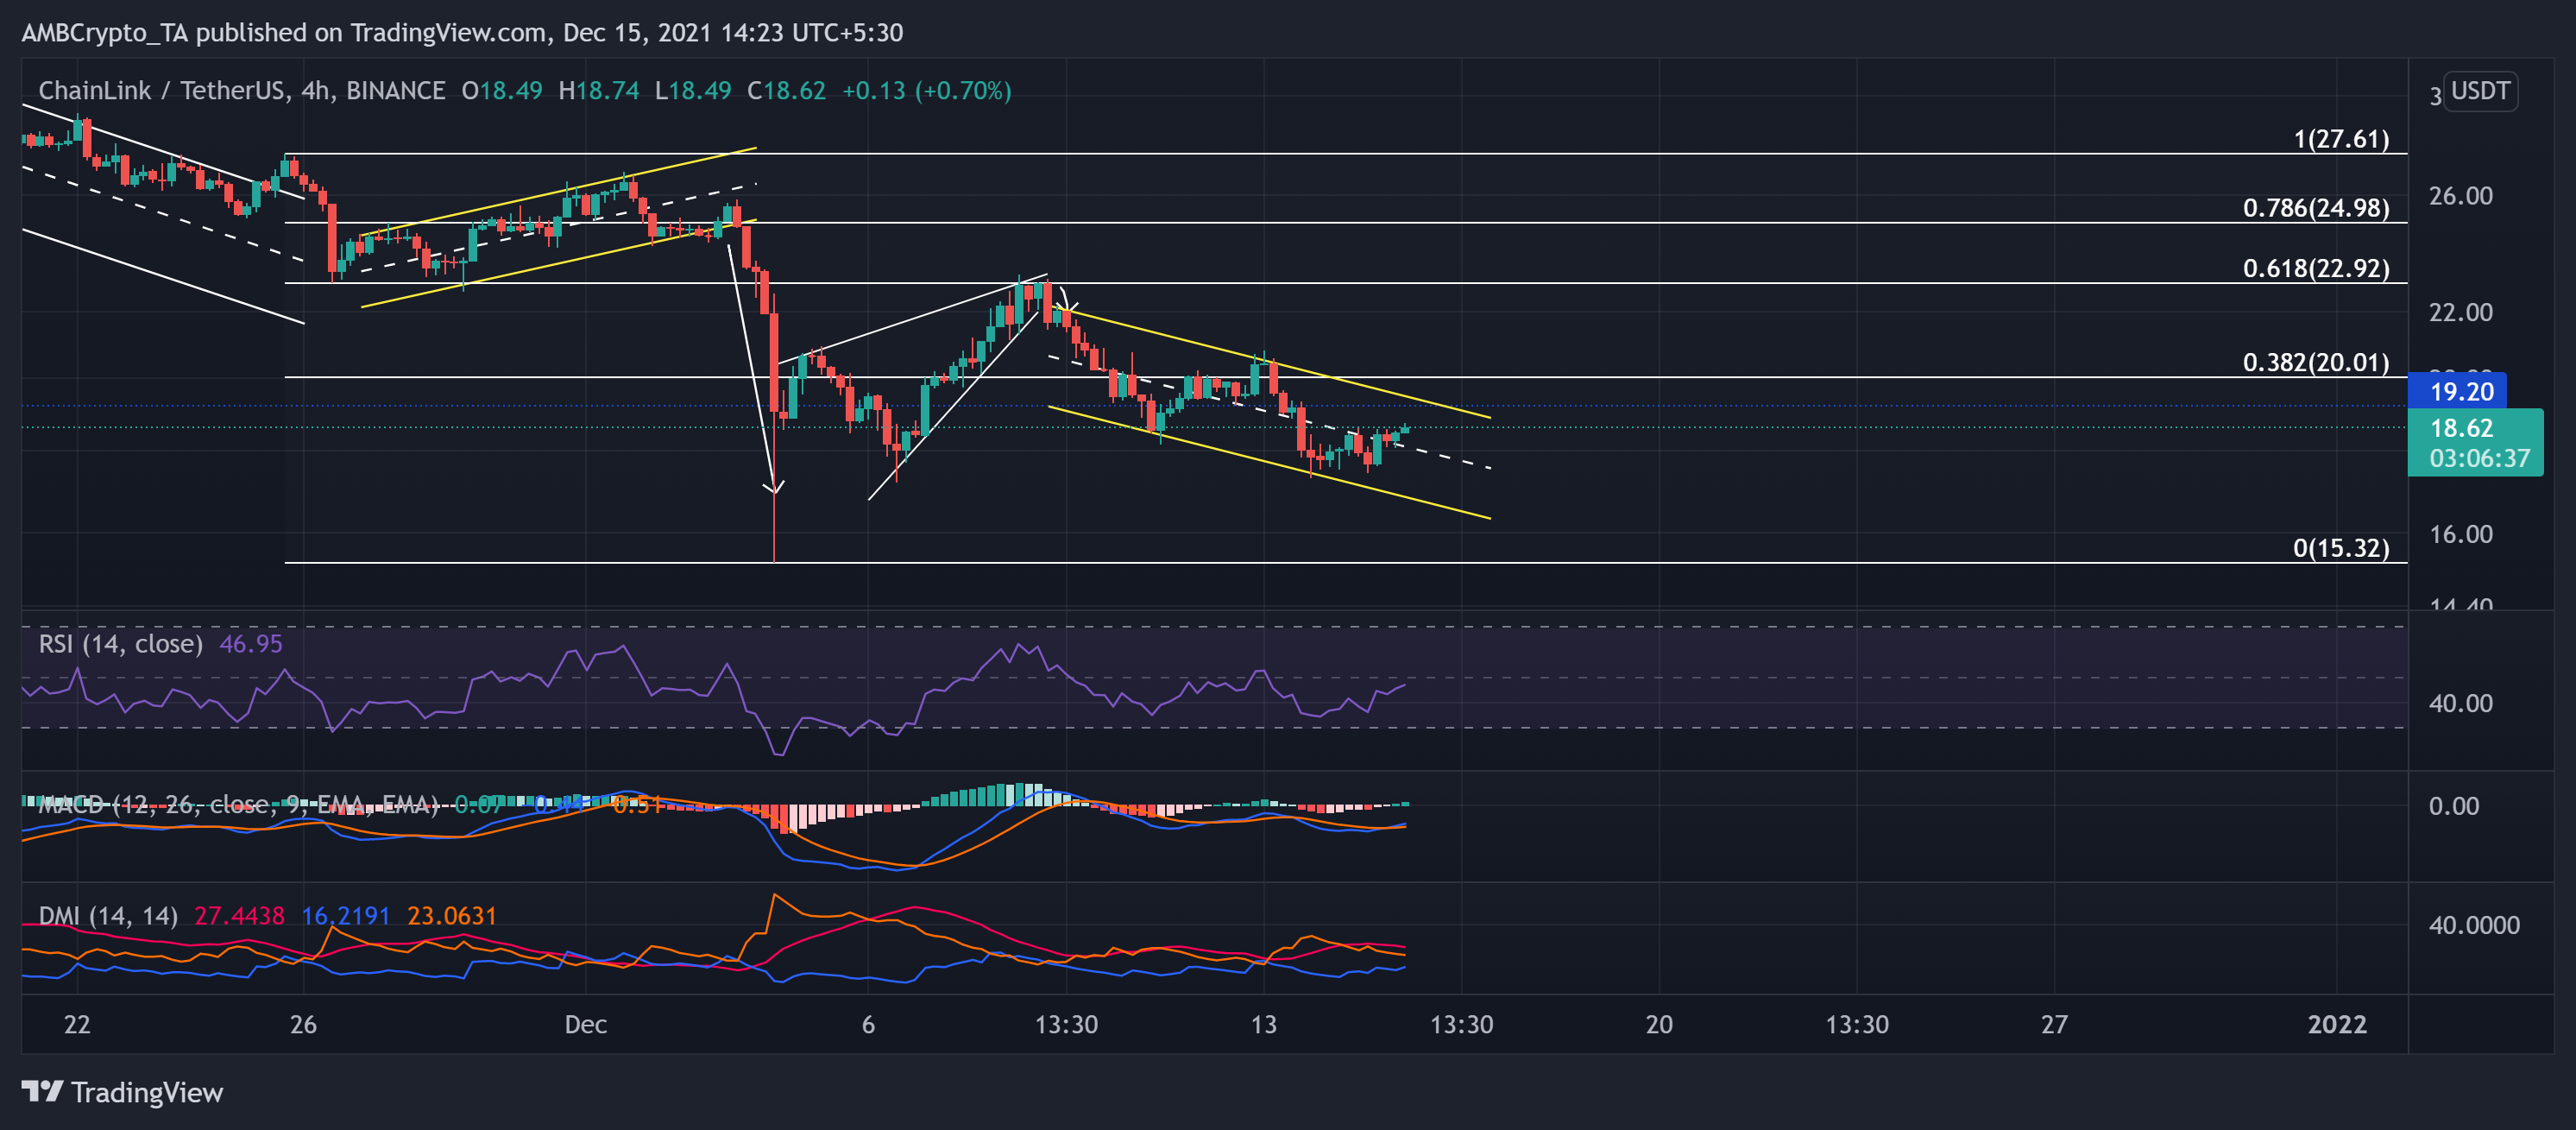
LINK witnessed a rising wedge breakout on 9 December as the price bounced back from the golden 61.8% Fibonacci resistance. As a result, the price action transposed into a down-channel (yellow) after noting a 17.61% decline over the past six days.
This fall pushed the price paction below its four-month-long resistance at the $19.2-mark. Over the past five days, the bulls retested the 38.2% Fibonacci resistance thrice but failed to pull off an edge. LINK continued its steady fall after hitting its six-month high on 10 November.
At press time, LINK traded at $18.62 after noting a nearly 3.9% 24-hour gain. The RSI swayed below the midline, hinting at a bearish preference but seemed to head towards the midline.
The MACD lines projected the near-term bullish push, but its lines still could not cross the zero level. Also, the DMI preferred the bears while showing a slight increase in bullish power. Presently, the immediate resistance stood near the upper channel at the $19.2-mark.
Uniswap (UNI)
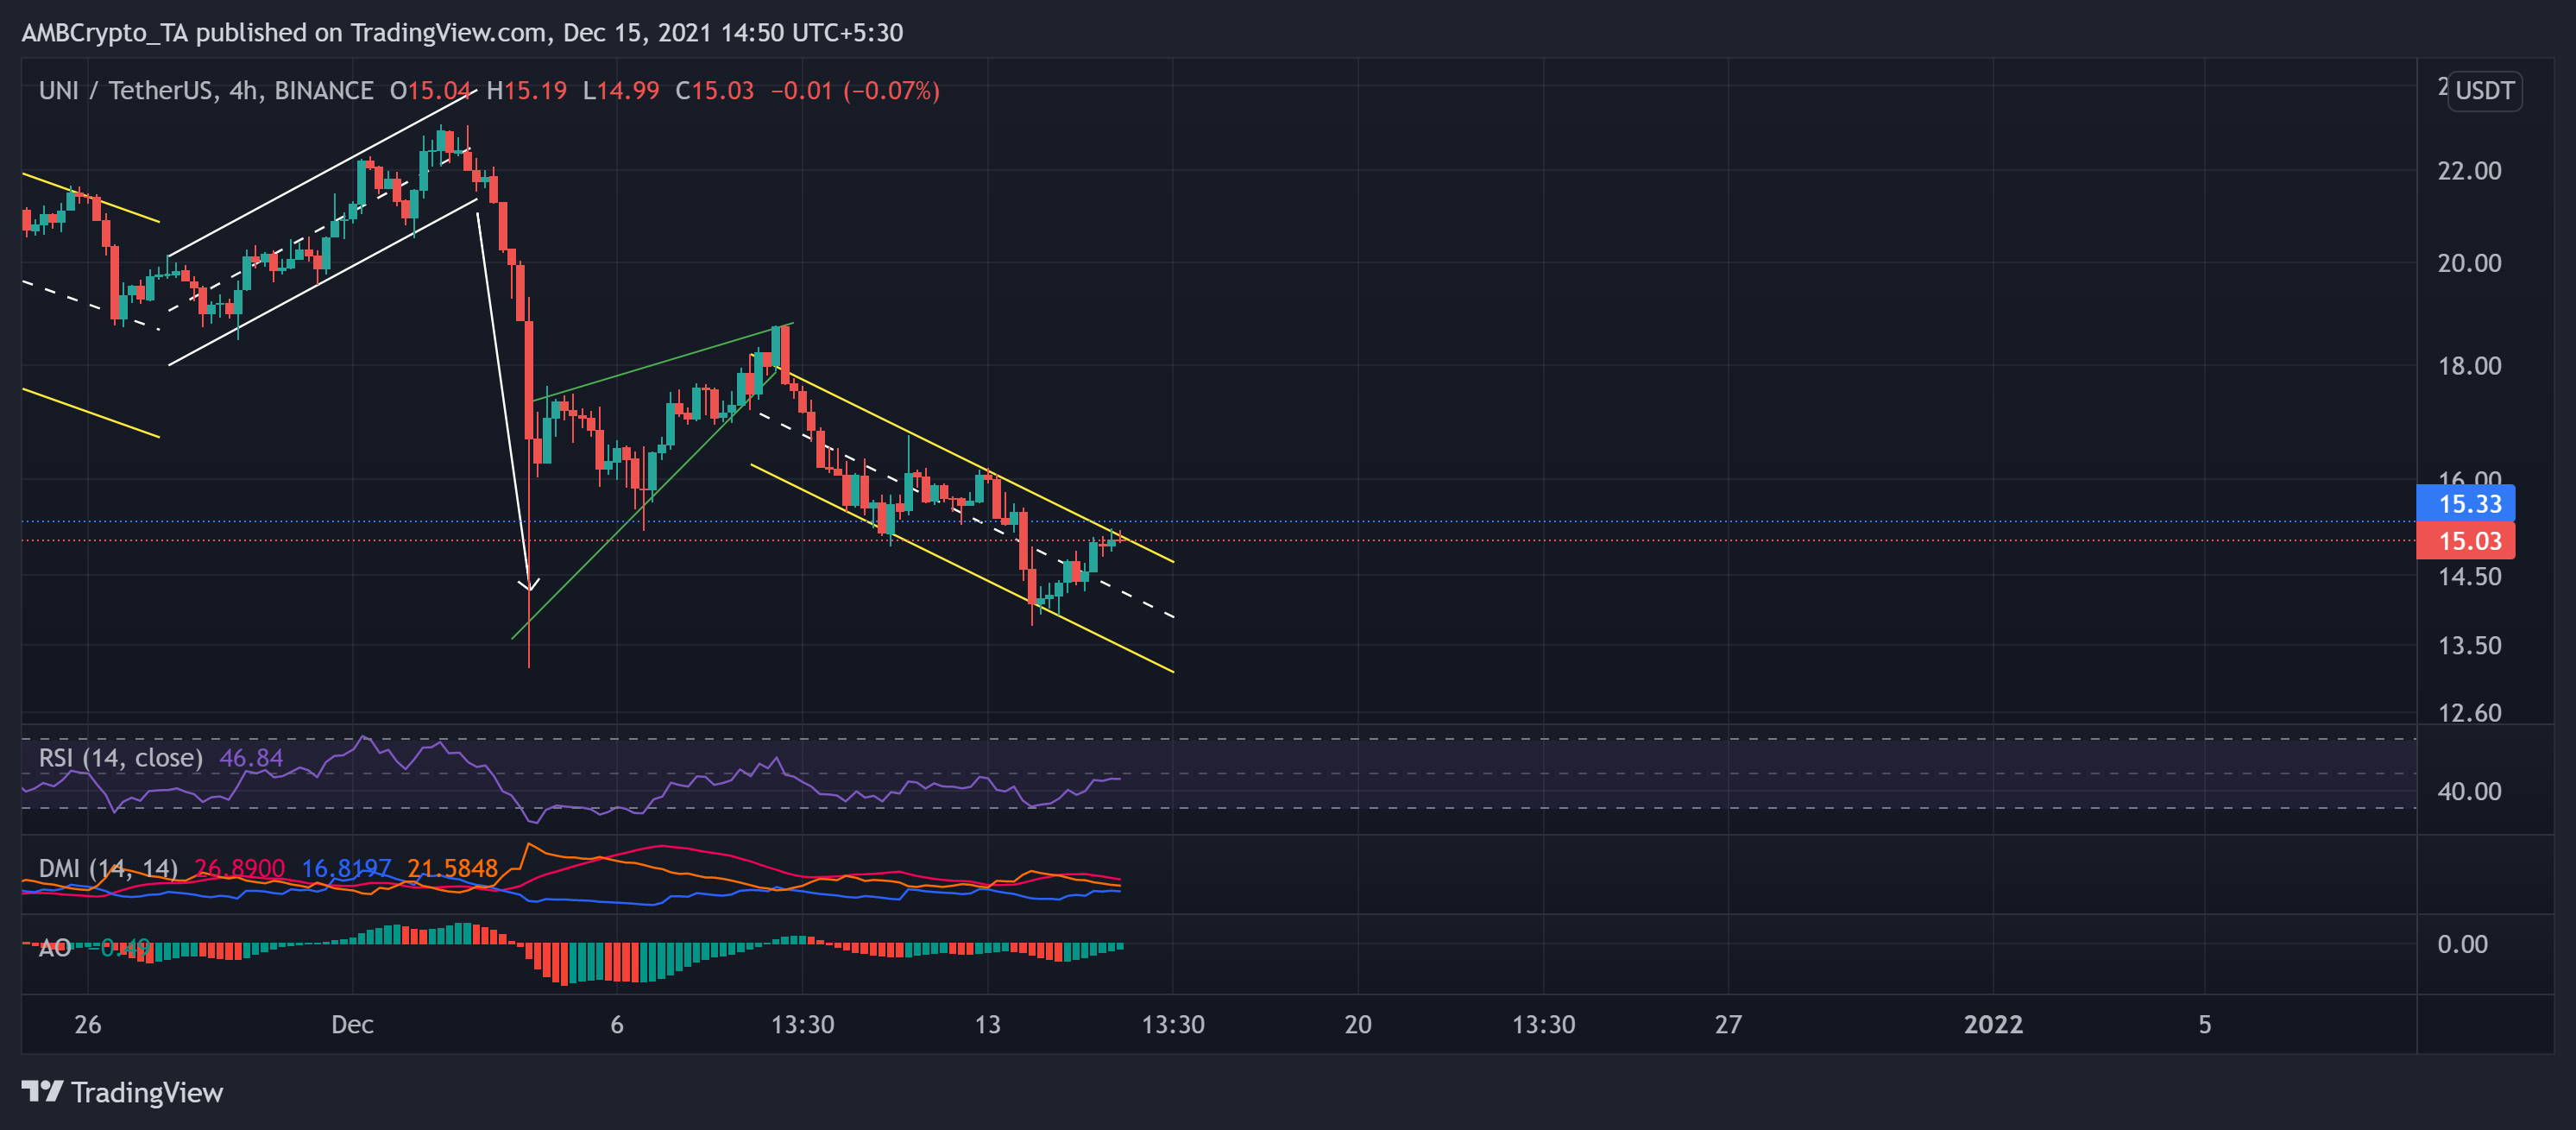
The bulls lost their edge after the price hit its two-month high on 10 November. As a result, the alt noted a 38.9% decline on its monthly chart and disapproval of its long-term bullish trendline.
UNI accelerated its month-long descent after an expected rising wedge breakout on 8 December. This decline formed a descending channel on its 4-hour chart and led the bears to breach the five-month-long bull resistance at the $15.33-mark. At press time, the alt traded at $15.03 after noting a nearly 4% 24-hour gain.
Although the RSI saw a 15 point surge in the past day, it continued to show resistance at the midline. Also, the DMI slightly preferred the bears as the +DI line struggled to stay above the -DI line for over a week now. Nevertheless, the AO projected the past 24-hour bullish push by heading towards the zero line.
AAVE
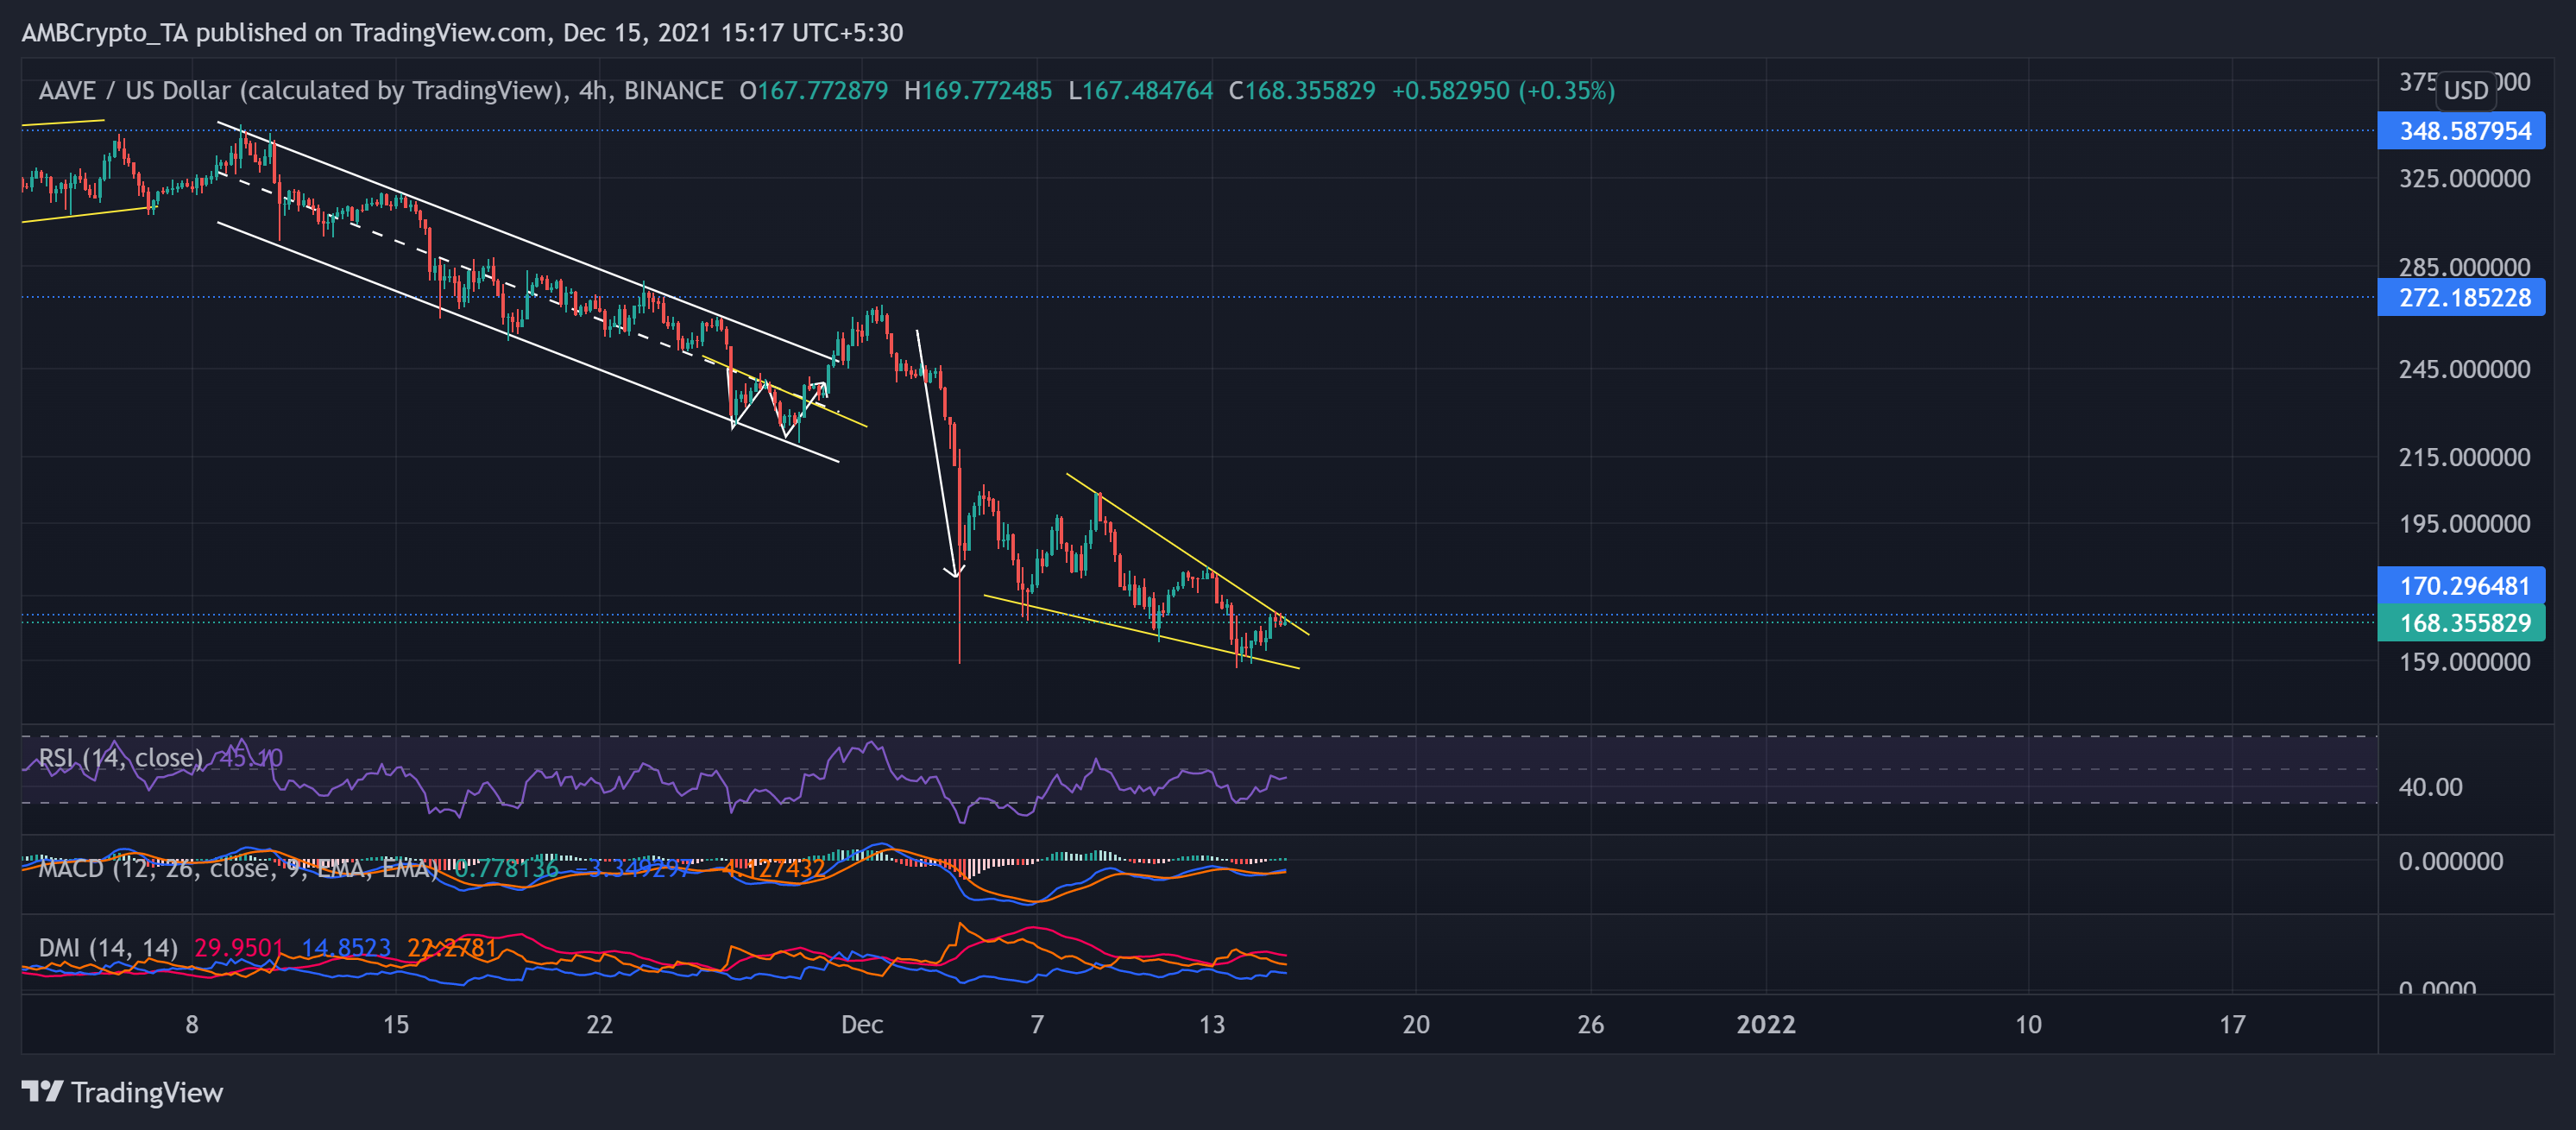
Since 9 November, the alt steadily pulled out and oscillated in a down-channel (white). After forming a double-bottom in late November, the price action saw a break out of the channel but immediately saw a sharp pullback. AAVE saw a monstrous 46.9% 30-day decline and poked its record low on 13 December at $157.29.
Now, Over the past nine days, AAVE marked a falling wedge (reversal) pattern on its 4-hour chart. At press time, AAVE traded at $168.35 after noting a 2.9% 24-hour gain.
The RSI showed promising revival signs in the last 24 hours. Also, the MACD histogram crossed the zero line and suggested an increasing buying power. However, the DMI continued to flash a bearish bias in the near term.