The Sandbox fails to hold on to $4.2 and slides further down below this support

The $4.5 area was identified as an area of demand for The Sandbox. However, the price was rejected at a crucial level and has been dropping steadily down the charts in the past couple of weeks. The momentum was strongly bearish, and a drop toward the $3.29 level was likely. A retest of the $4-$4.5 area can be a shorting opportunity. Bitcoin has also descended beneath $40.5k and had its support at $37.3k. Market sentiment continued to be bearish, for SAND as well across the market.
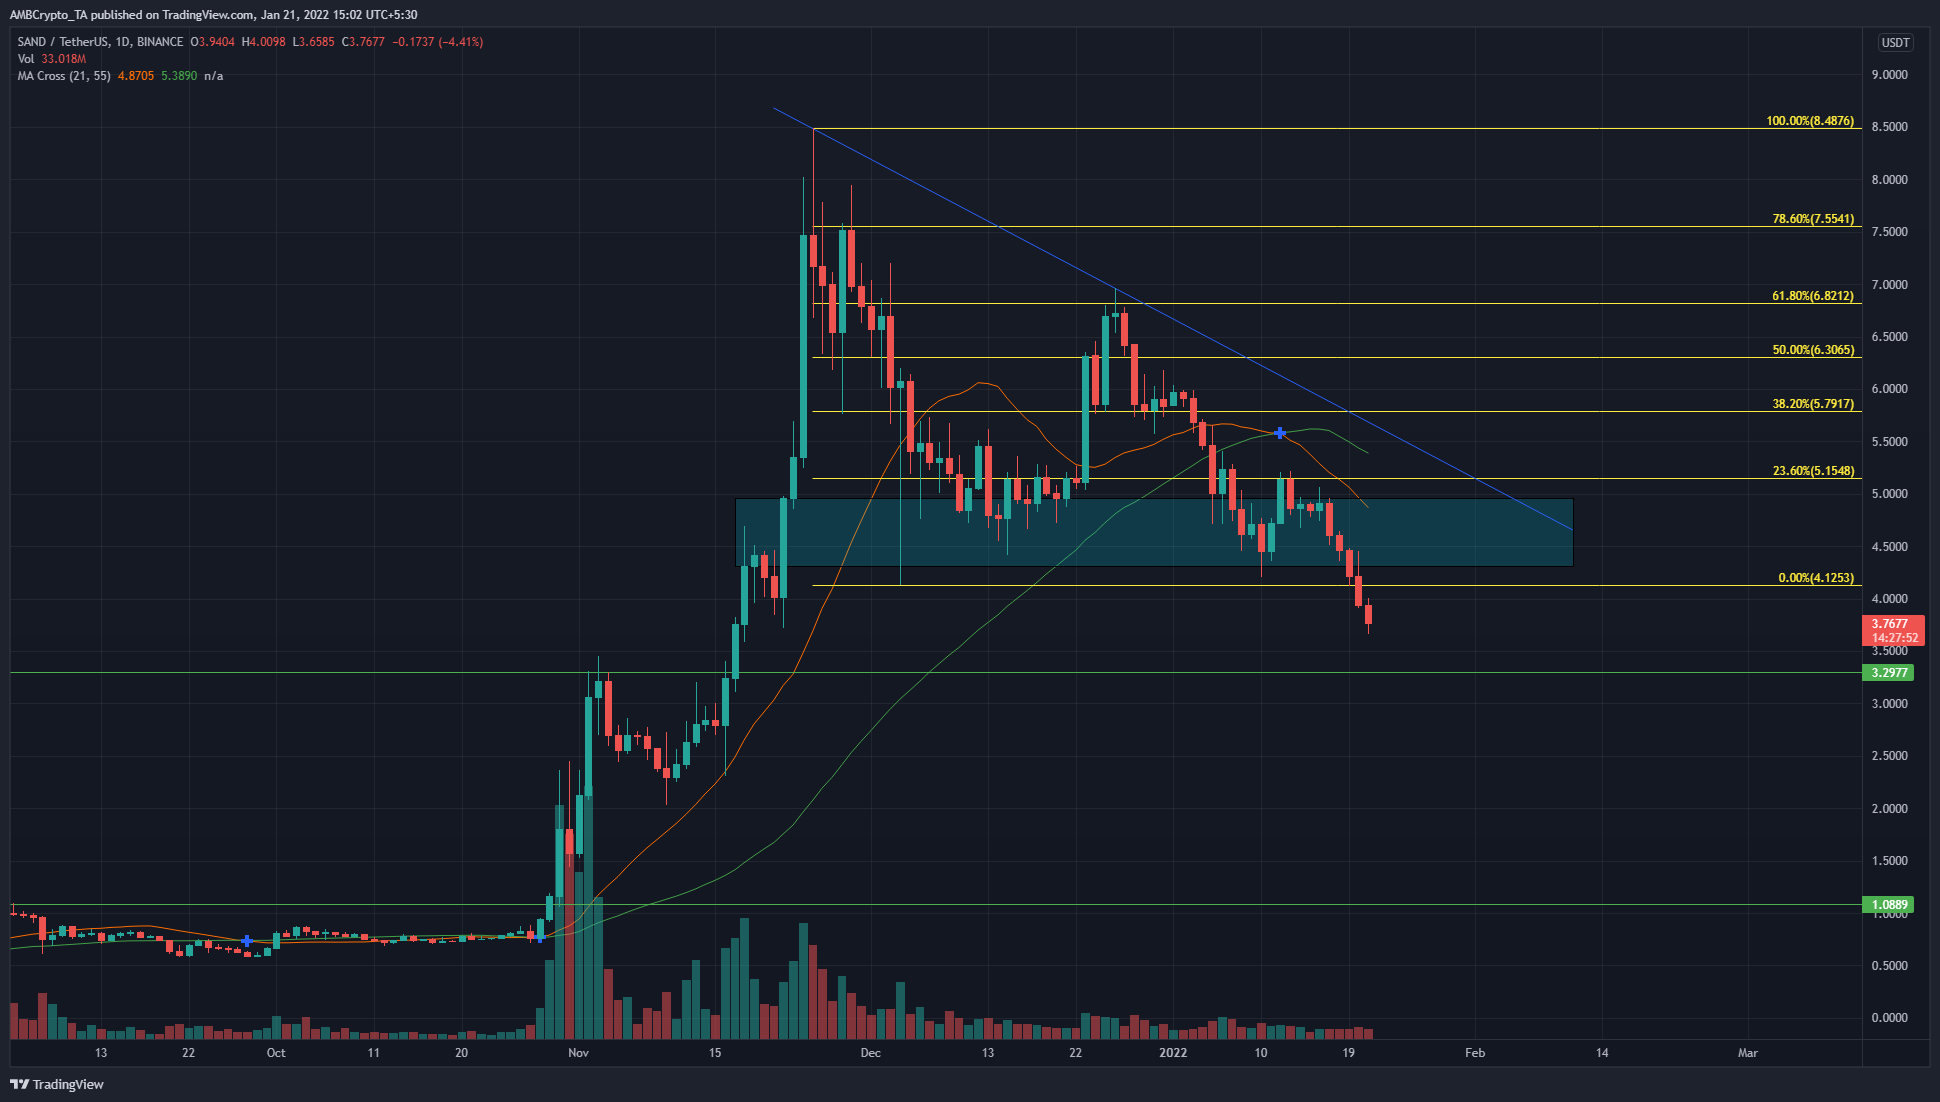
The $4.5 level was one that the price had tested as resistance in mid-November before it barreled ahead to $8.48 highs. Using those highs, and the early December sell-off wick to $4.12, a set of Fibonacci retracement levels (yellow) were plotted.
A couple of weeks ago, the price had some buyers for a day or two and looked like it could break past the $5.15 level and flip it to support. Flipping the 23.6% retracement level, followed by consolidation, is something that many coins do on higher timeframes that signals a downtrend’s end.
However, SAND was strongly rejected at $5.15 and has lost nearly 27% in value since then. The next level of support for SAND lay at $3.29.
Rationale
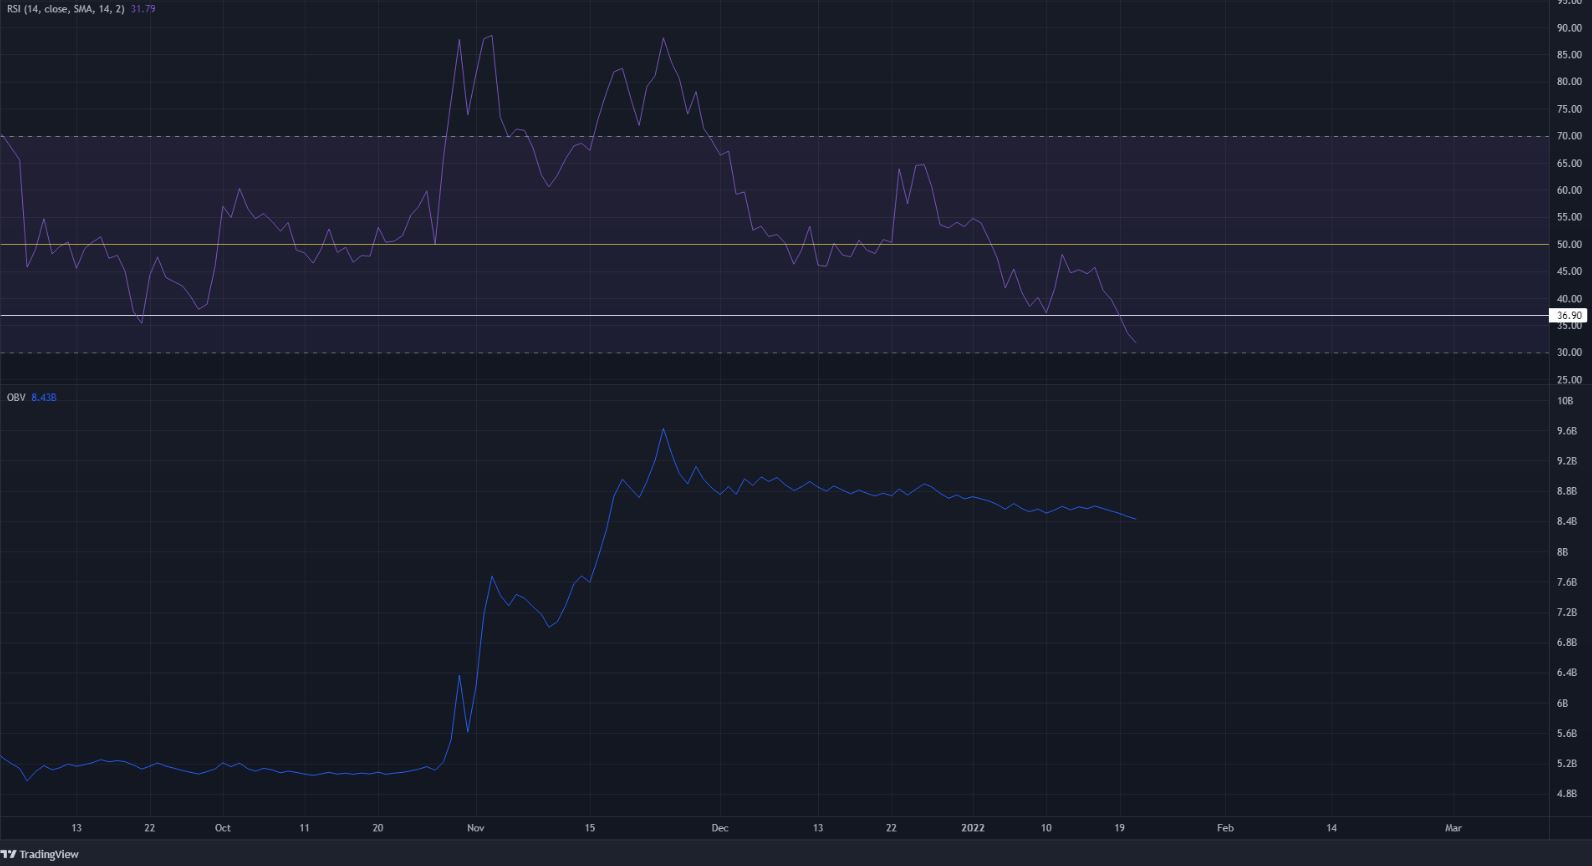
The daily RSI leaned heavily in favor of the bears as the reading stood at 31.7 at press time. Moreover, on the daily RSI, the 36.9 level and its vicinity have seen the RSI bounce. A sharp drop right past this level has, in the past, been followed by heavy losses. For instance, such a drop in the RSI in May and June was followed by a near 30% drop in the next couple of days.
History need not repeat but it does rhyme.
On the OBV too, a downtrend has been seen in the past couple of months, although the selling volume was not as heavy as the one-way traffic we say in November’s bull run for SAND. The 21-period moving average had crossed bearishly beneath the 55-period moving average (orange and green respectively).
Conclusion
In summary, the momentum was strongly in favor of the bears. A buying opportunity was not found on the larger timeframes, with the $4-$4.5 being areas where a short position can be assessed. On the charts, support for SAND was next at the $3.29 and the $2.93 levels.