Axie Infinity shorters MUST keep this in mind before selling

Disclaimer: The findings of the following analysis are the sole opinions of the writer and should not be considered investment advice
After hitting its ATH on 6 November, Axie Infinity (AXS) commenced its downturn in a descending channel (white) while the bears kept testing the crucial $46-support.
As AXS enters a low volatile phase, the chances of a volatile move in the days to come will be much higher. Any close below the $45-support would trigger a shorting signal while confirming the descending triangle.
Should the support hold good, the alt could continue its squeeze phase for a while before it conforms to the long-term trend. At press time, AXS was trading at $46.598.
AXS Daily Chart
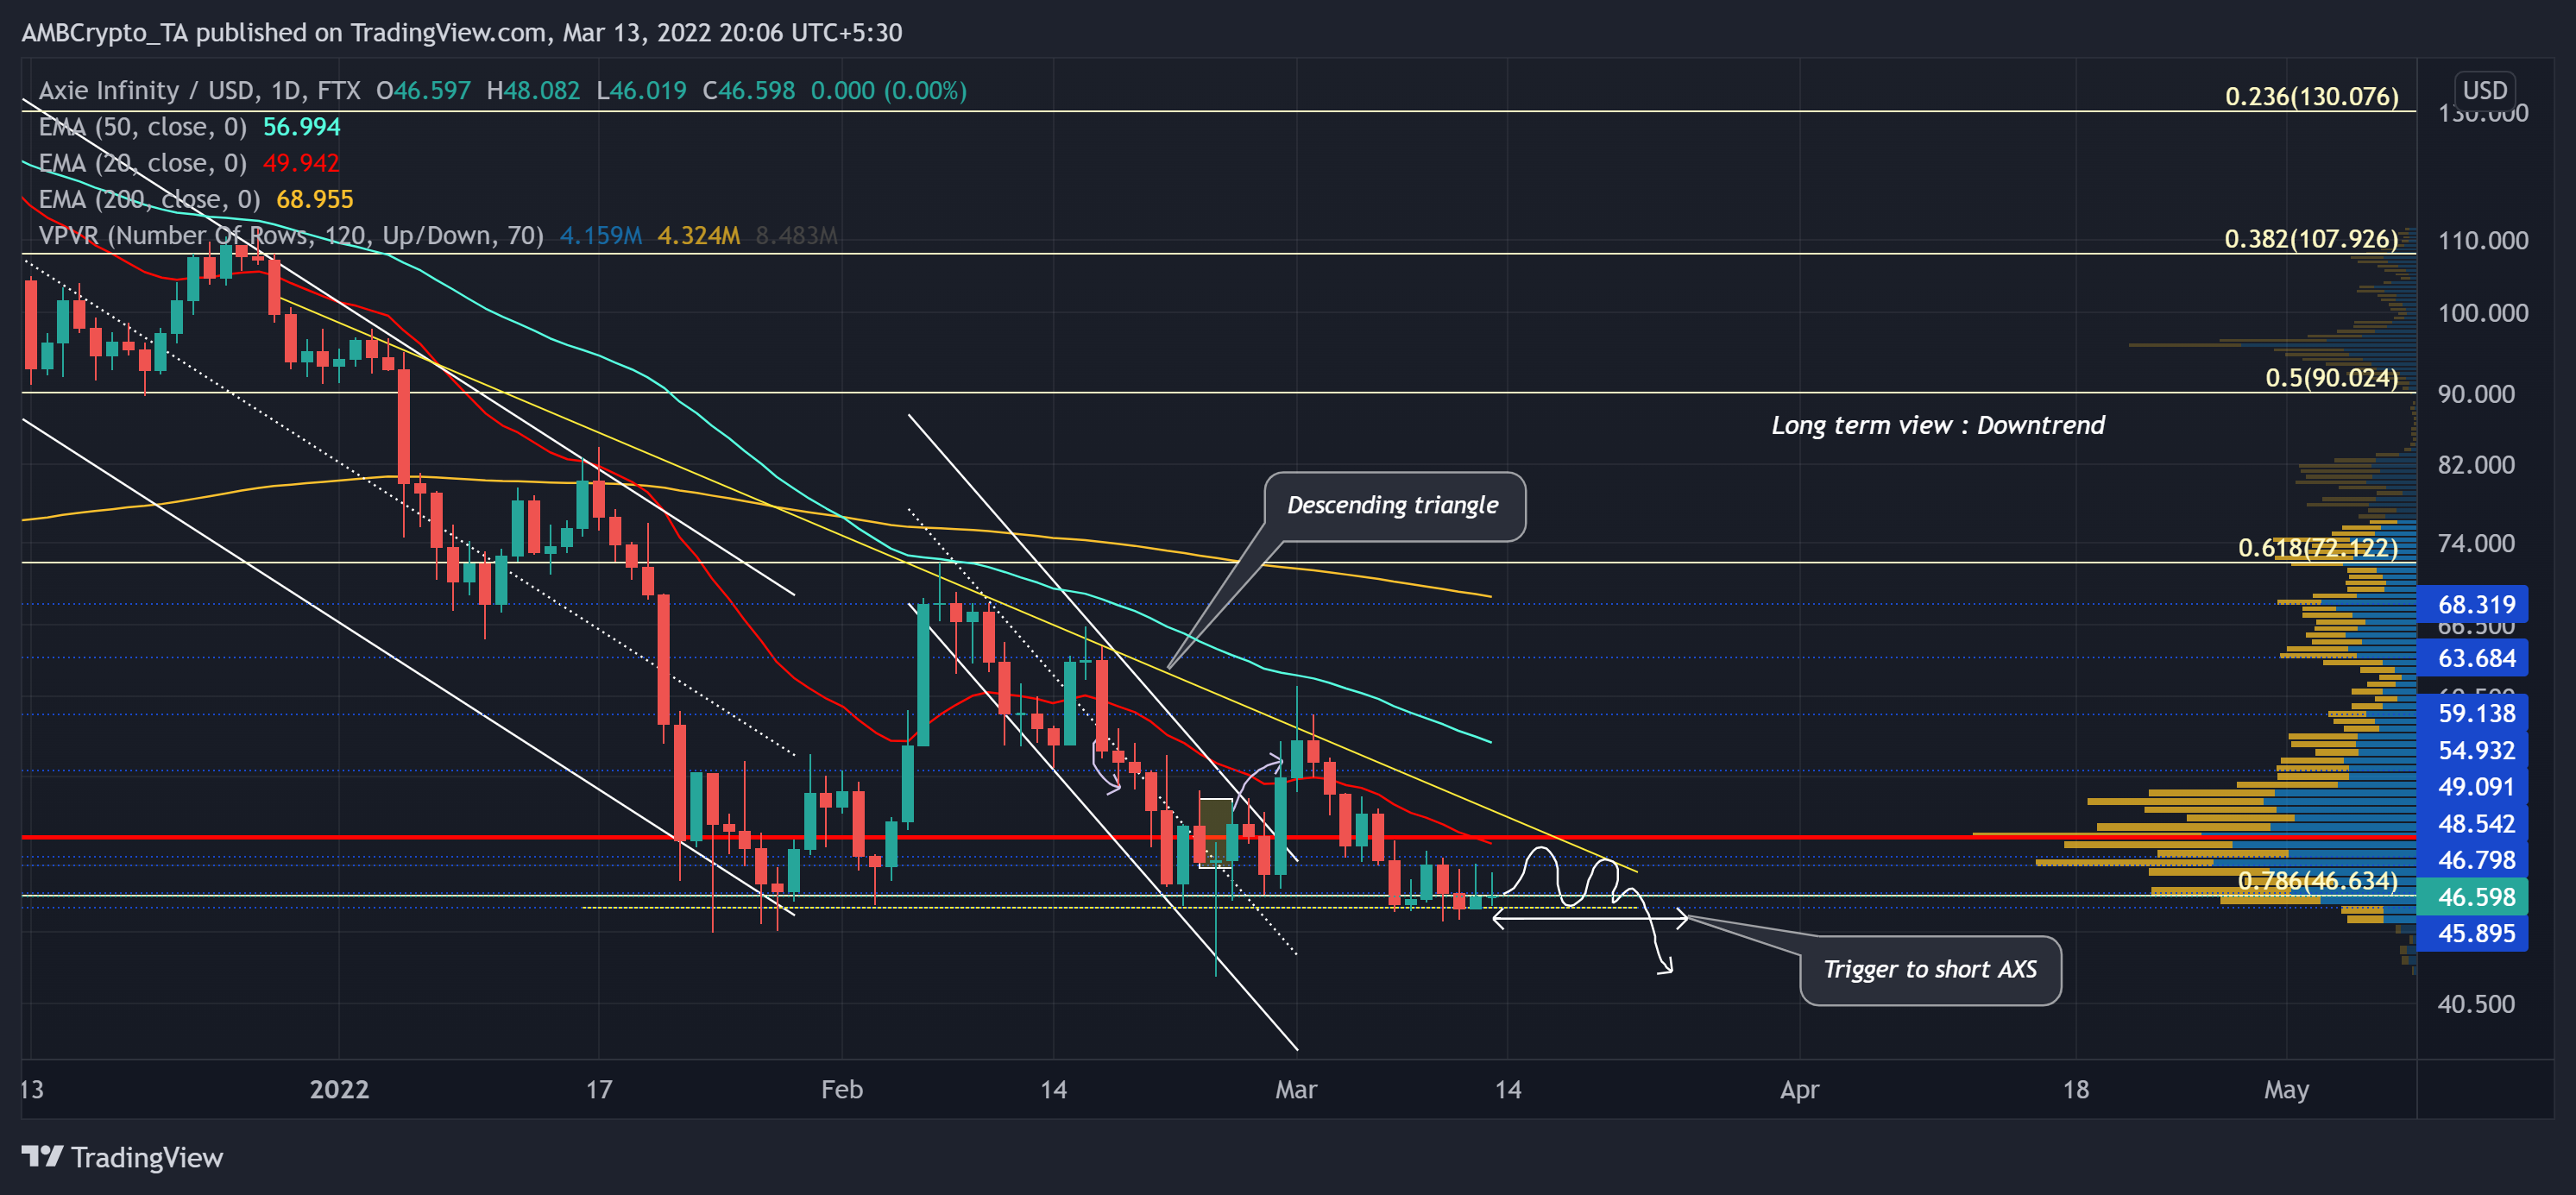
The retracement phase marked two down channels (white) on its daily chart as the alt lost nearly 74.4% of its value (Since its ATH) and touched its six-month low on 24 February. As a result, AXS struggled to sway above its Point of Control (POC, red).
Throughout its descent, the alt kept snapping through vital Fibonacci support levels while upholding the 78.6%-level. As a result, AXS flashed a descending triangle on its daily chart over the last ten weeks. While the sellers revealed their advantage, the gap between the 20-50-200 EMA has significantly widened.
Now, the immediate support is vital for the bulls to defend to prevent a major fallout. Any bullish comebacks in the near term would continue to find resistance at the POC and the upper trendline of the triangle.
Rationale
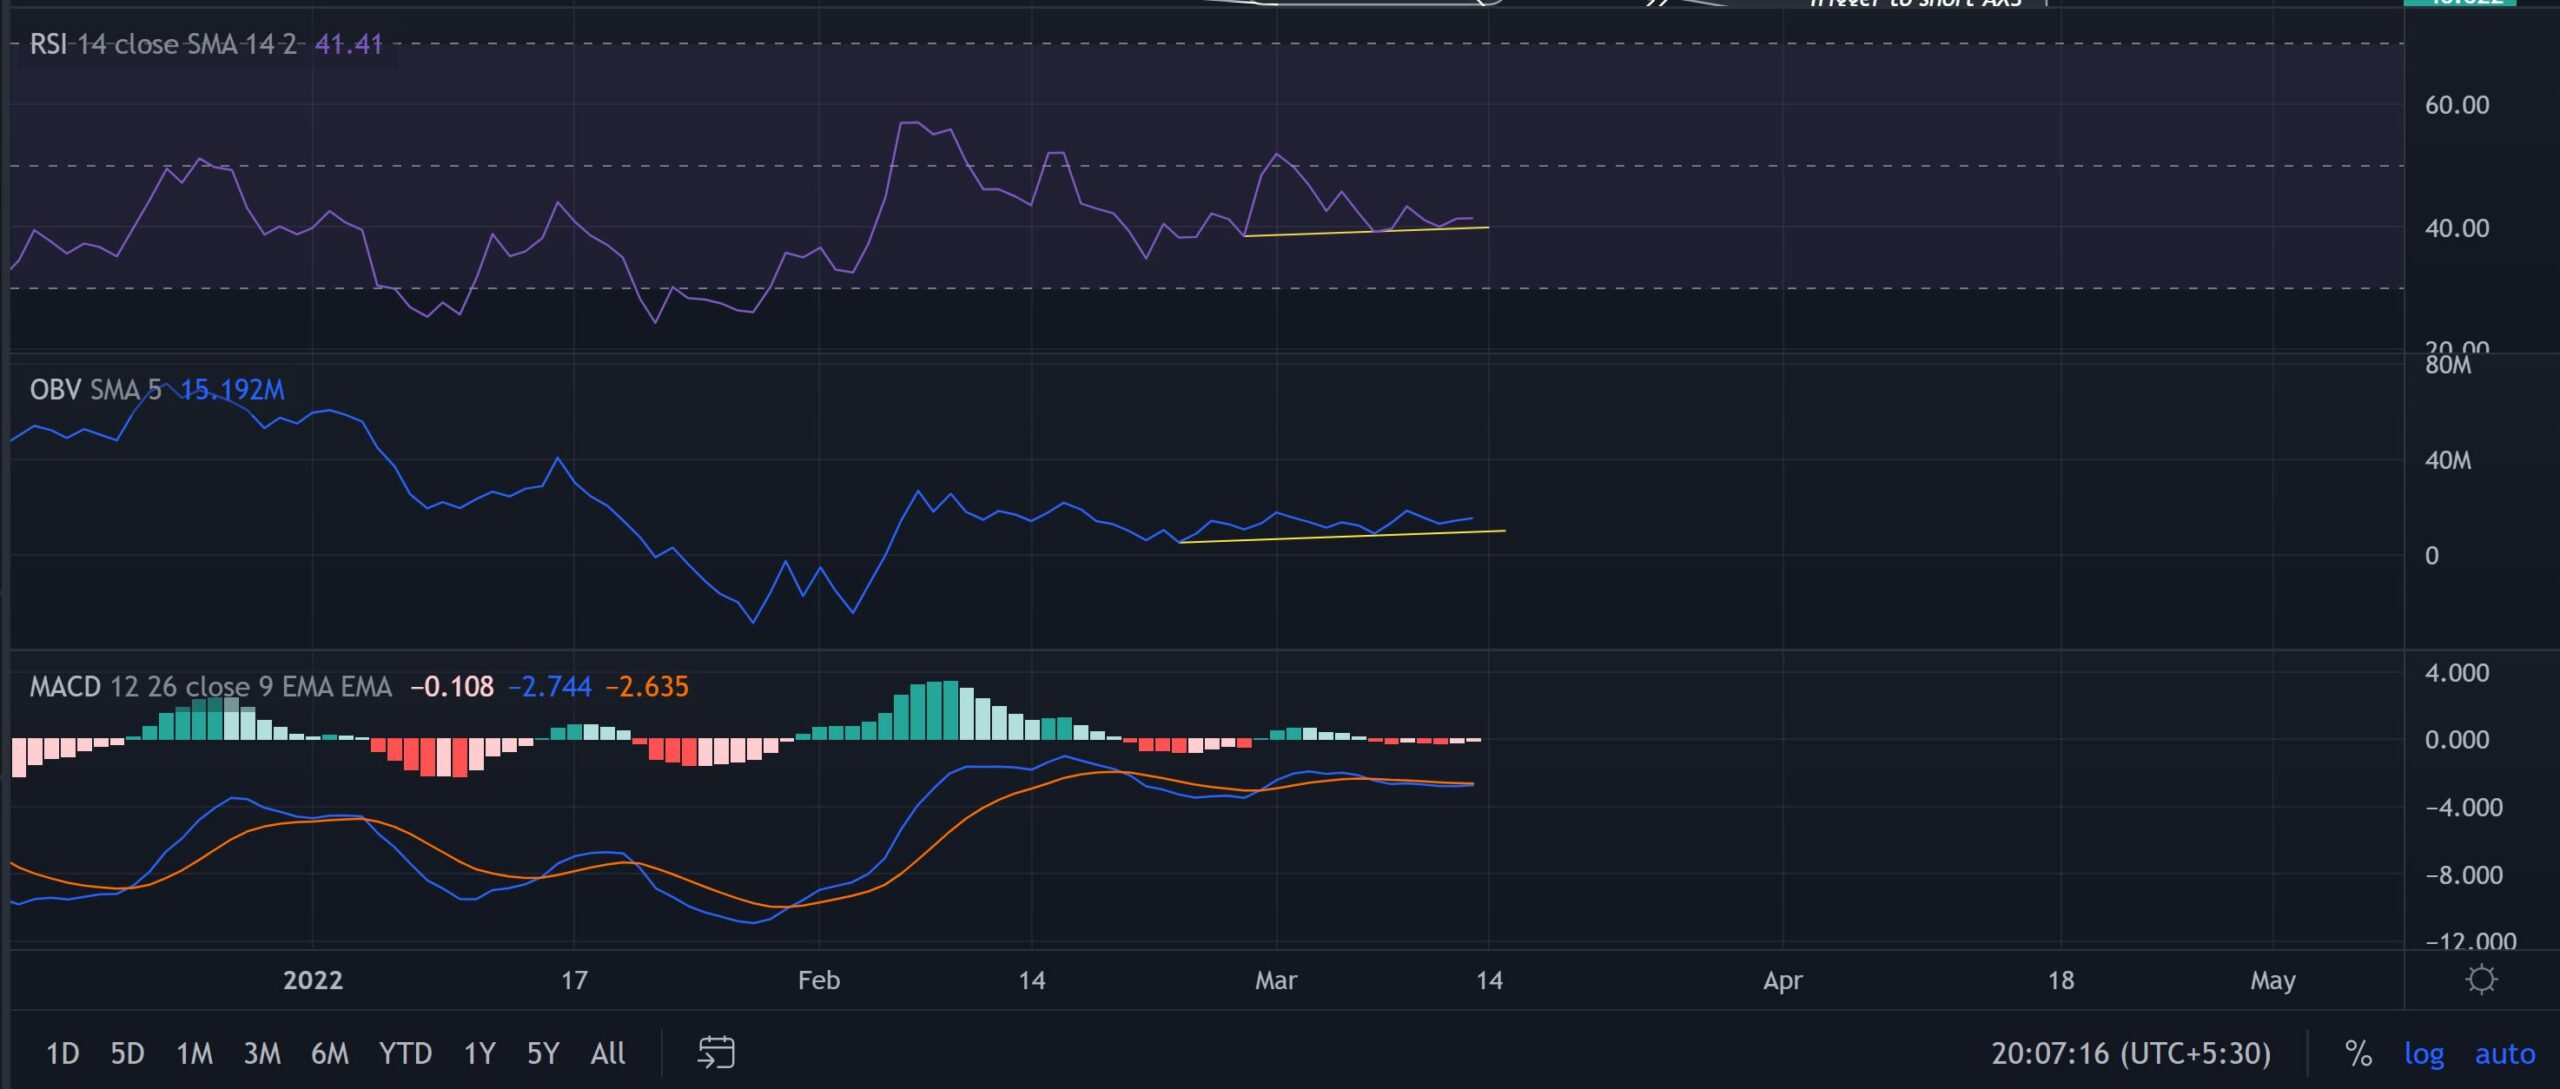
If the RSI obliges to its trendline support, it would confirm a bullish divergence. In such a case, AXS would gain some thrust to test its immediate resistance. Also, the OBV followed a similar trajectory and insisted on not underestimating the buying power.
Nevertheless, the MACD lines still struggled to close above the midline while the histogram continued to be in a tight phase.
Conclusion
One cannot eliminate the near-term revival chances in light of the readings on its RSI and OBV. But, its long-term tendencies favored the sellers, as evidenced by the descending triangle.
Moreover, the alt shares an 80% 30-day correlation with Bitcoin. Thus, keeping an eye on Bitcoin’s movement would be essential towards making a profitable move.


