Why staying away from The Graph token may be a good idea despite its 38% rally
The Graph price has risen roughly 38% in the last three days shows signs that it might continue this run-up. As bullish as this scenario sounds, on-chain metrics suggest that hedging on GRT will be a bad idea as it could be a long-squeeze in disguise.
More than meets the eye
The Graph price might seem bullish from a technical outlook and even the on-chain volume shows a massive spike, which hints that the run-up is likely to continue. The volume rose from 37 million on 12 March to 393 million on 16 March.
This 962% uptick in on-chain volume indicates a high investor activity with the Graph blockchain. Such spikes are often considered bullish if they occur at the end of a massive correction or retracements.
Although the on-chain volume could have been crucial for the 38% gain over the past few days, the run-up is unlikely to sustain going forward as indicated by other on-chain metrics.

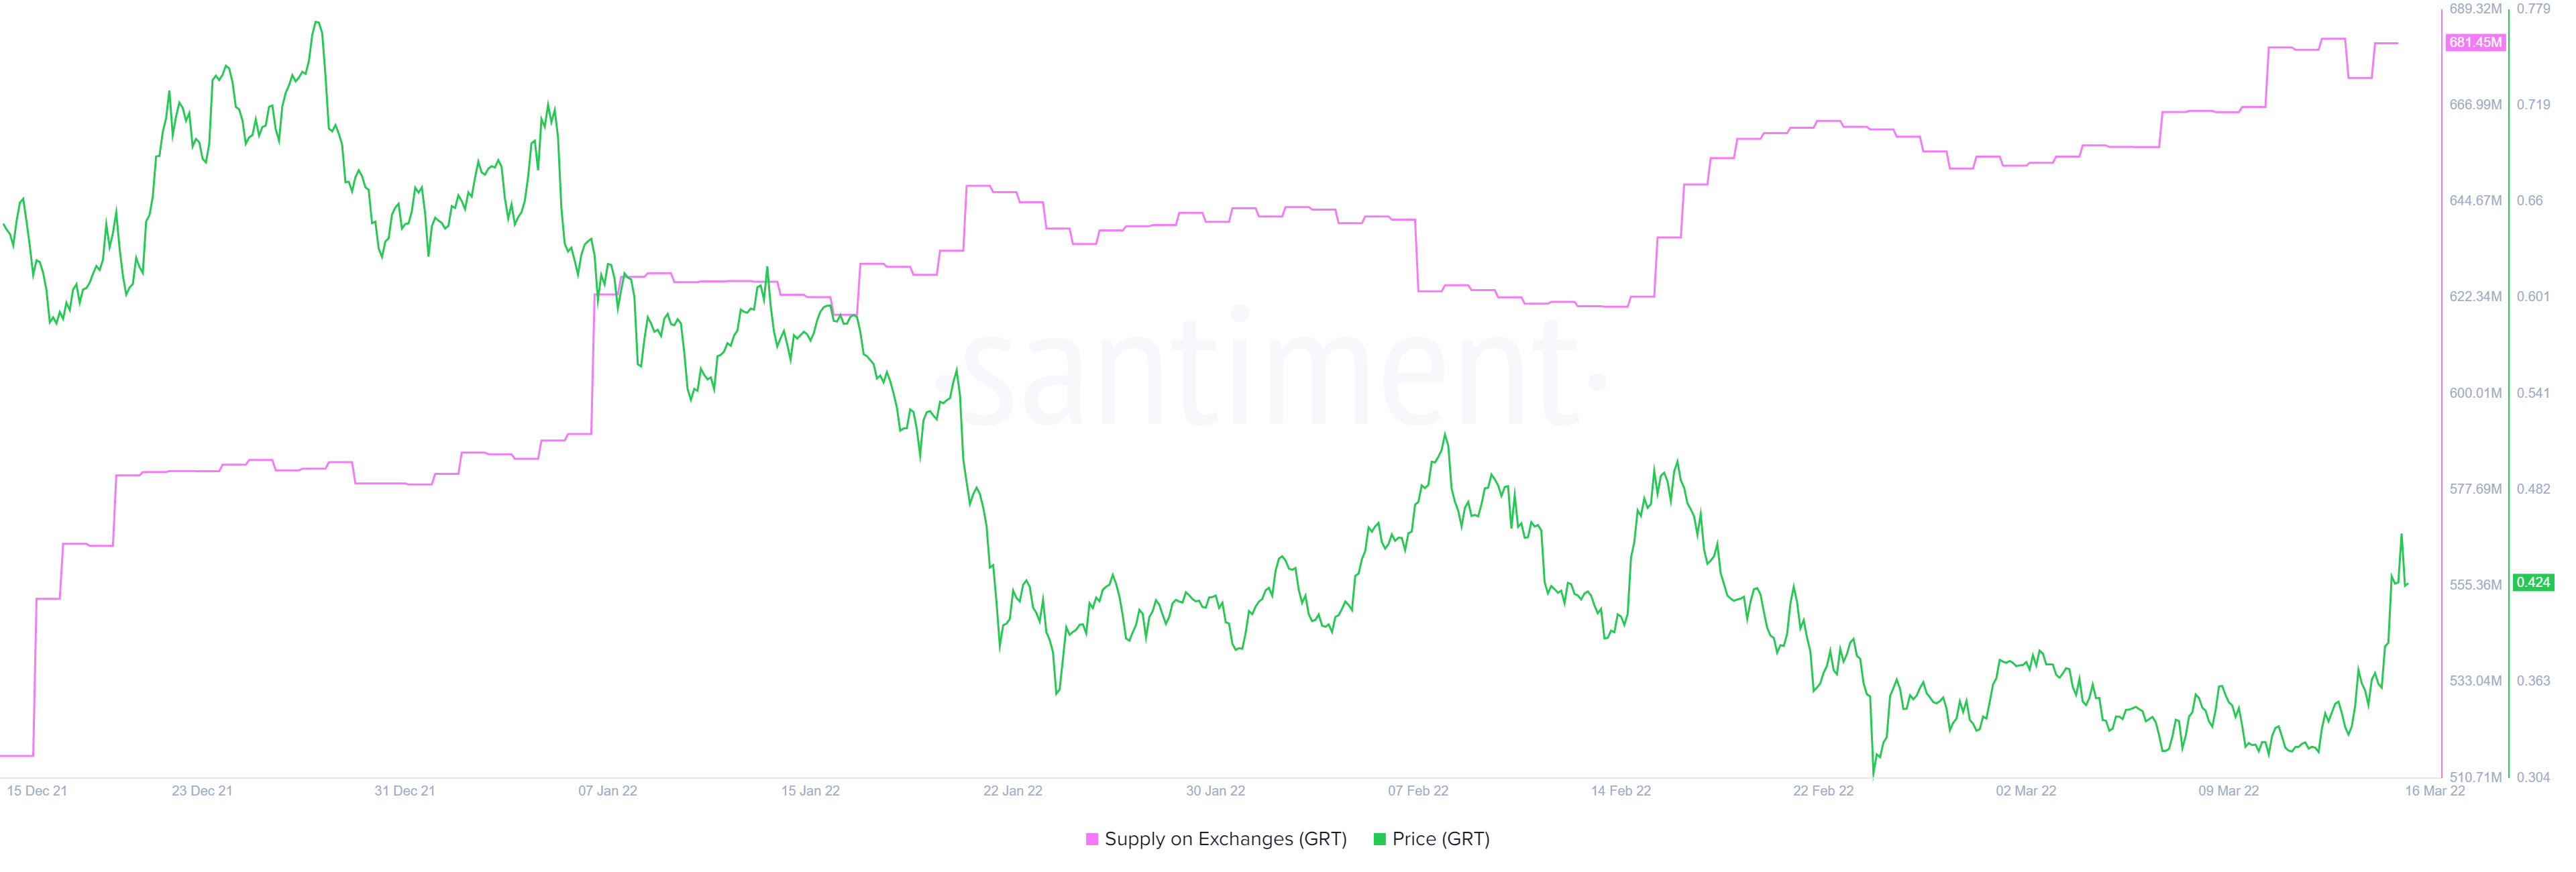
The supply on exchanges is a metric that can be used to assess the potential sell-side pressure present on exchanges. If the number of tokens held on exchanges increases, it indicates that these holders are likely to sell when push comes to shove. Such a snowball effect is one of the reasons why flash crashes extend way lower than they ideally should.
For GRT, the number of tokens held on exchanges spiked from 515 million in December 2021 to 681 million on 16 March. This 32% spike with 166 million GRT tokens being sent to centralized entities reveals that these tokens could be to book profits.
Market participants should note that not all of the supply present on exchanges is a sell-pressure, some of it is used to provide collateral while others could be used to earn interests or more.
Regardless, this spike in GRT on exchanges is a big red flag.
Moreover, the active deposits metric shows a much clearer picture of the sell-side pressure. This index spiked from 3.7 to 31 in the last four days, suggesting that the investors are rushing to exchanges to book profits.

All in all, the Graph price might look appealing due to the returns observed in the past week, but on-chain metrics like supply on exchanges and active deposits clearly indicate the short-term spike in selling pressure.
Therefore, market participants need to exercise caution and take another look at GRT before investing.


