MANA could see these levels before a trend committal move

Since late November, Decentraland (MANA) has been on a steady downtrend while the bulls were adamant about defending the $2-support.
Now, with the recent increase in selling pressure, the buyers could find it tricky to find a close above the current pattern. A reversal from the $2.3-zone could propel a restest at the $2.1-base before MANA makes a trend commital move. At press time, the alt traded at $2.3162, up by 2.84% in the last 24 hours.
MANA Daily Chart
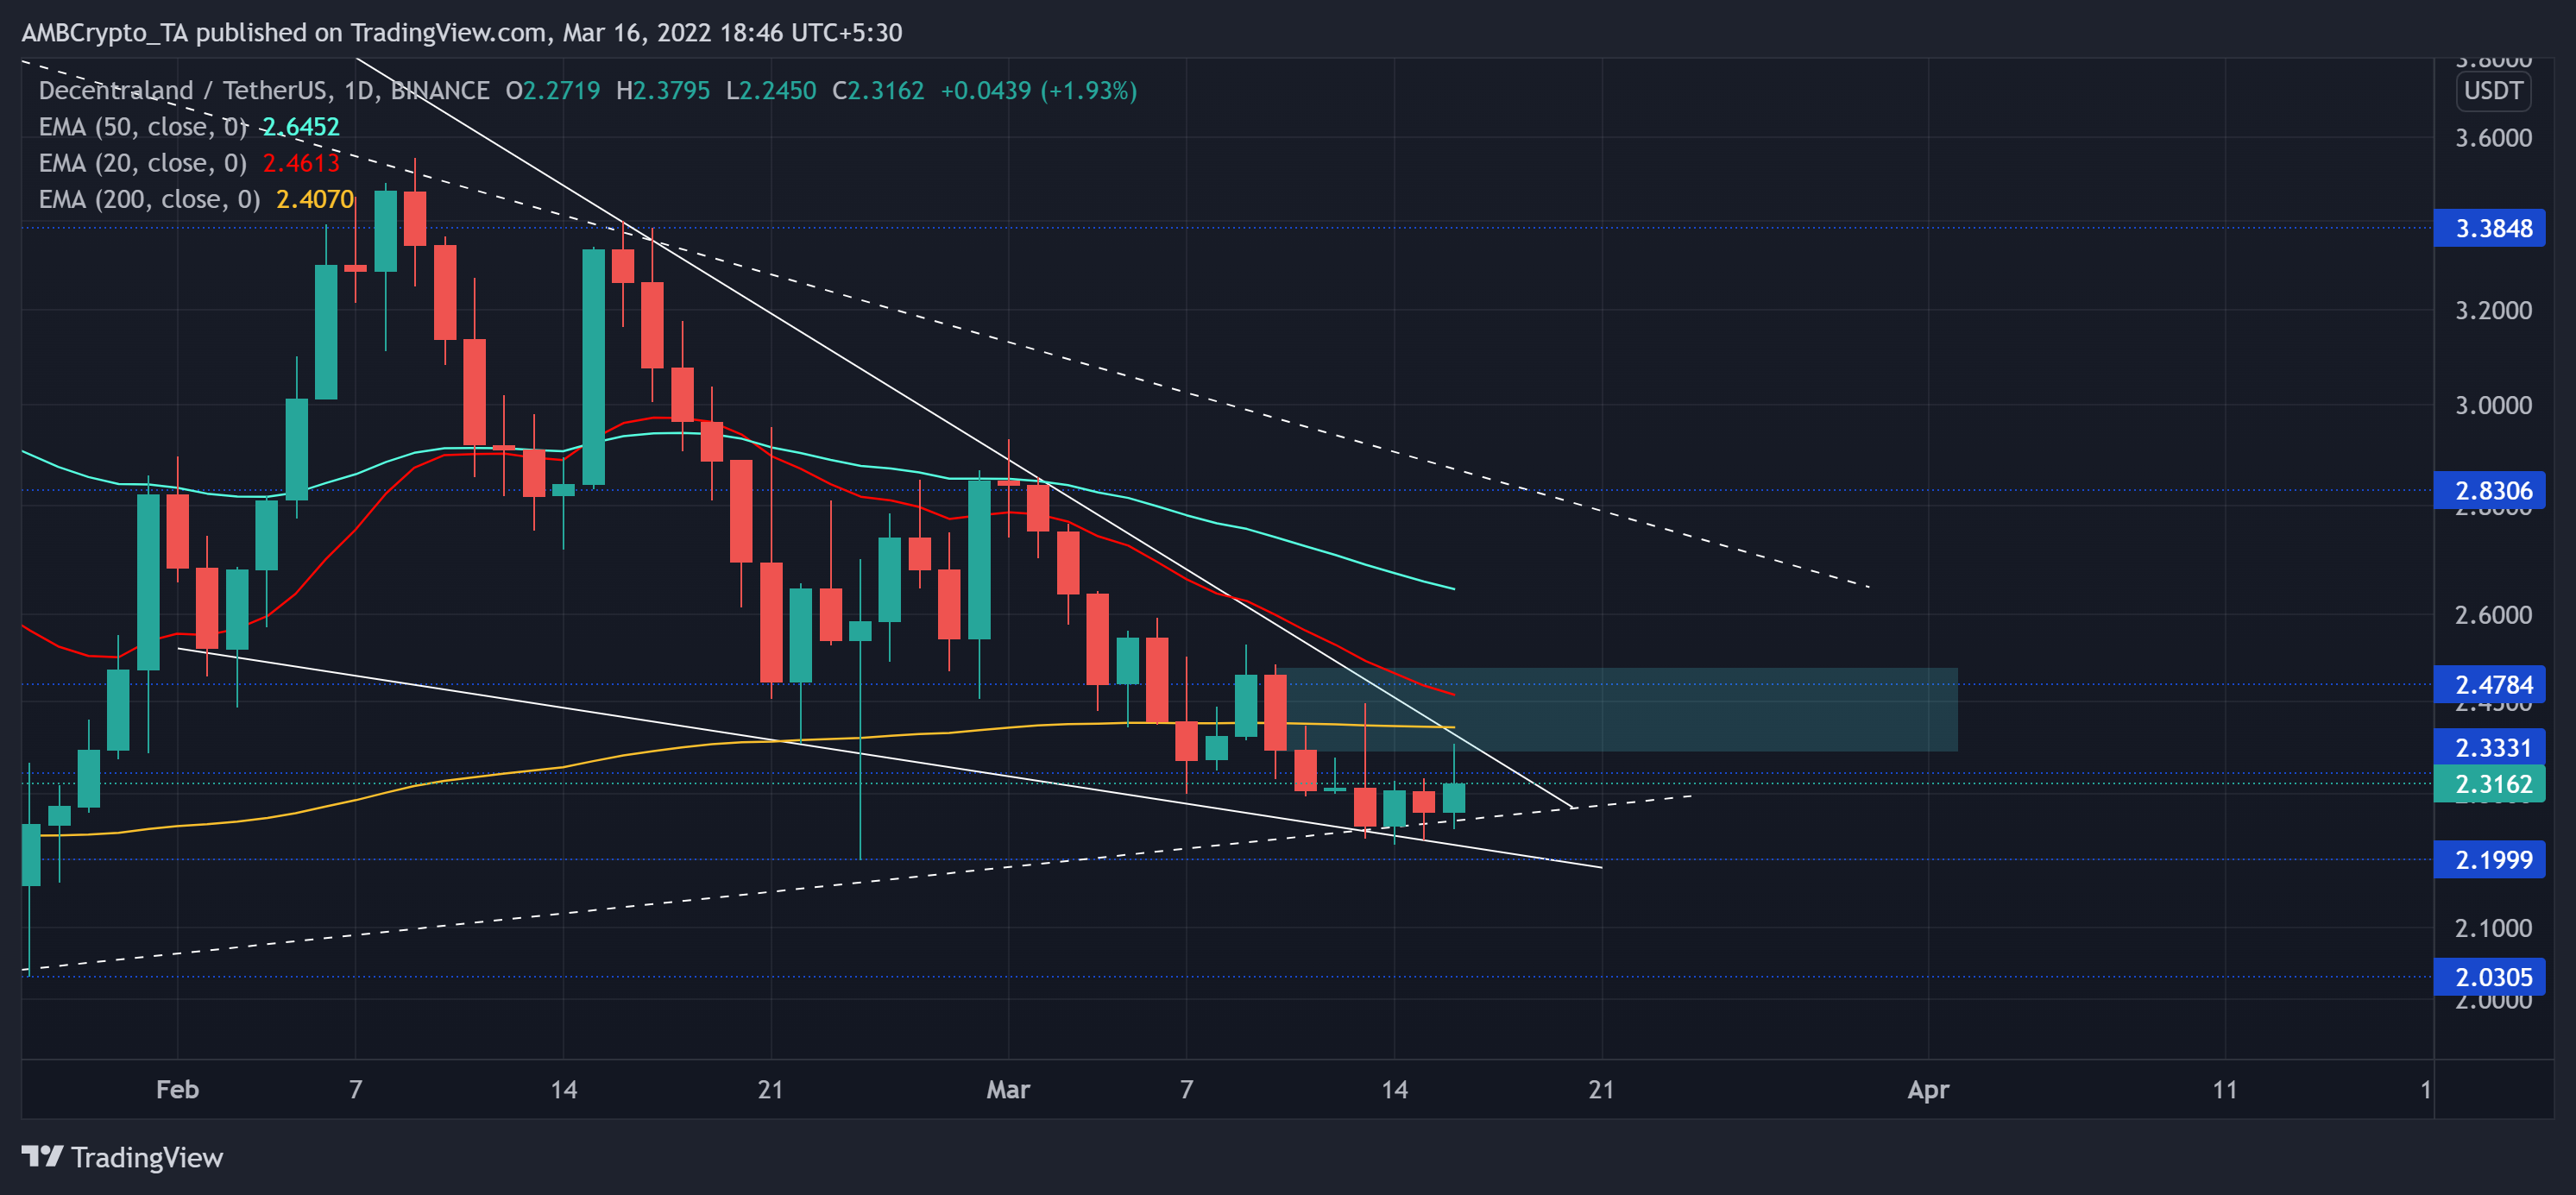
After a gradual downslide from its ATH, the alt lost over 70% of its value and poked its 11-week low on 22 January. Since then, MANA saw a solid recovery before reversing from its three-month trendline resistance. Post which, it descended below its 20 EMA (red) and 50 EMA (cyan).
Over the past month, MANA fell in a falling wedge on its daily chart. The price has entered into a tight phase in the last three weeks. Thus, increasing the chance of a possible volatile phase in the days to come. The recent bearish engulfing candlestick created a strong supply zone for the alt in the $2.3-$2.5 range.
From here on, any close above the current resistance could lead to a test of the upper trendline of the wedge before a test of the $2.1-base. Following this, any patterned breakouts could find a tough time overturning the supple zone. While the 20 EMA approached closer to the 200 EMA, a bearish crossover would reaffirm the near-term bearish force.
Rationale
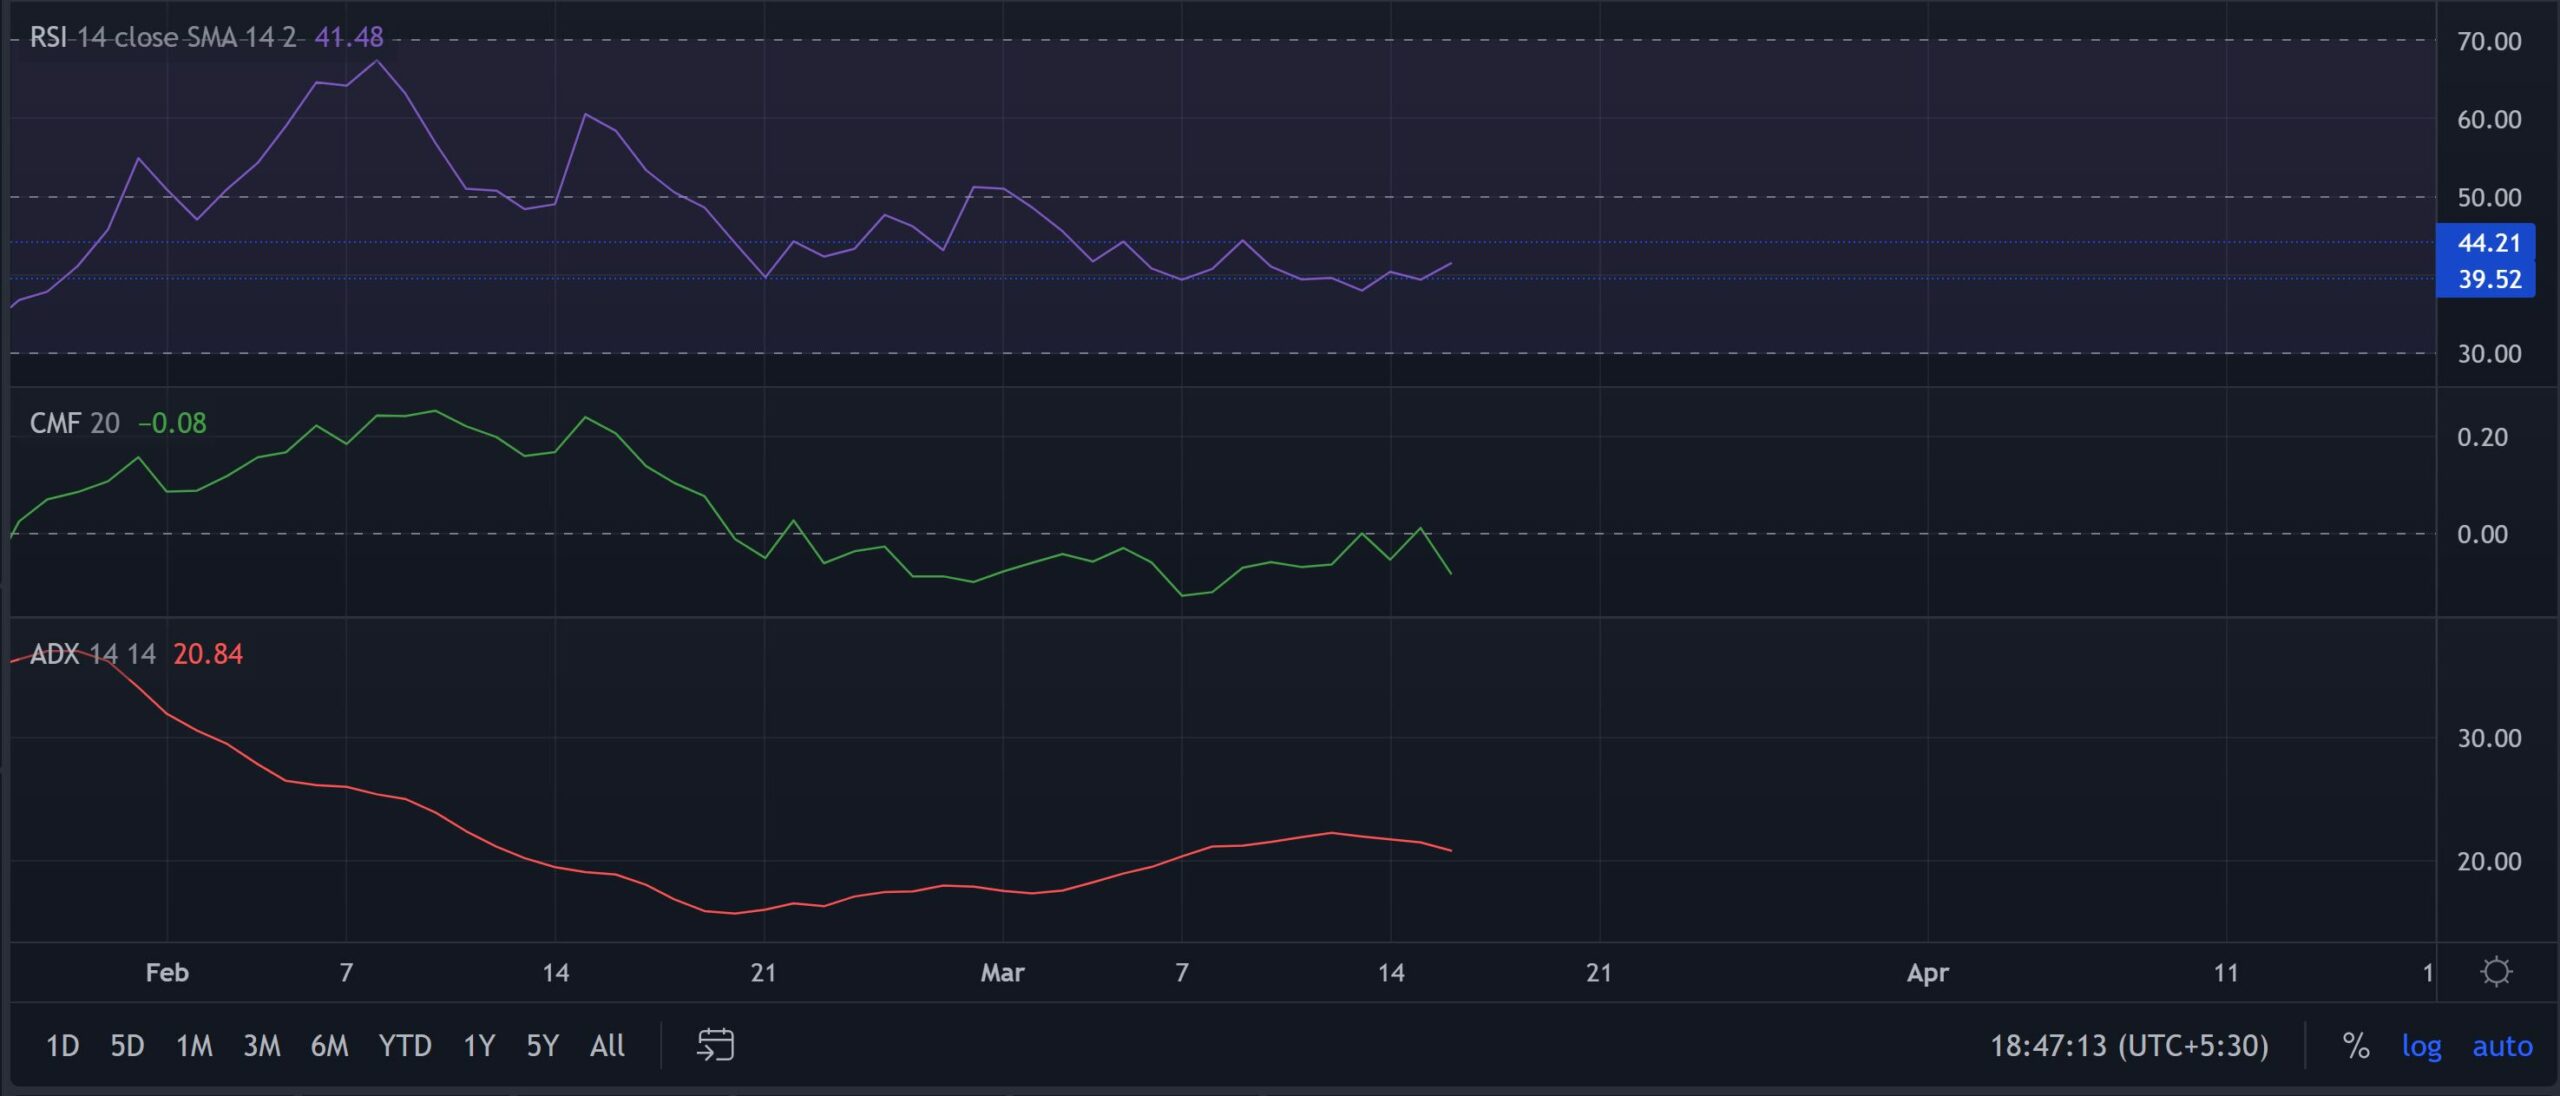
The RSI swayed sideways for the past five days and resonated with the price for the most part. Going forward, any bullish comebacks could find resistance near the 44-mark.
Further, the CMF steeply fell below the zero-line as it looked south. This reading hinted at the decreasing money flows into the crypto whilst the overall sentiment was still dominated by fear. To top it up, the ADX continued to display a weak directional trend for the alt.
Conclusion
Considering the recent supply zone and decreasing money flows, the buyers will need to ramp up volumes to topple the existing reversal pattern. Even so, the alt shared a 63% 30-day correlation with Bitcoin. So, keeping a watch on the king coin’s movement would be crucial to complement the above analysis.


