What SHIB shillers should expect- Accumulation phase or steady downtrend

Disclaimer: The findings of the following analysis are the sole opinions of the writer and should not be considered investment advice
Shiba Inu has fallen beneath a level of support and continued on its downtrend, but the slight rise in buying volume could be important. This was because, even though the market structure was bearish, this buying volume has stepped in at a logical zone of retracement. Now the question is- Which is the more likely outcome, further downside or a bounce? Bitcoin was also likely to have a say over the next few days.
SHIB- 2 Hour Chart
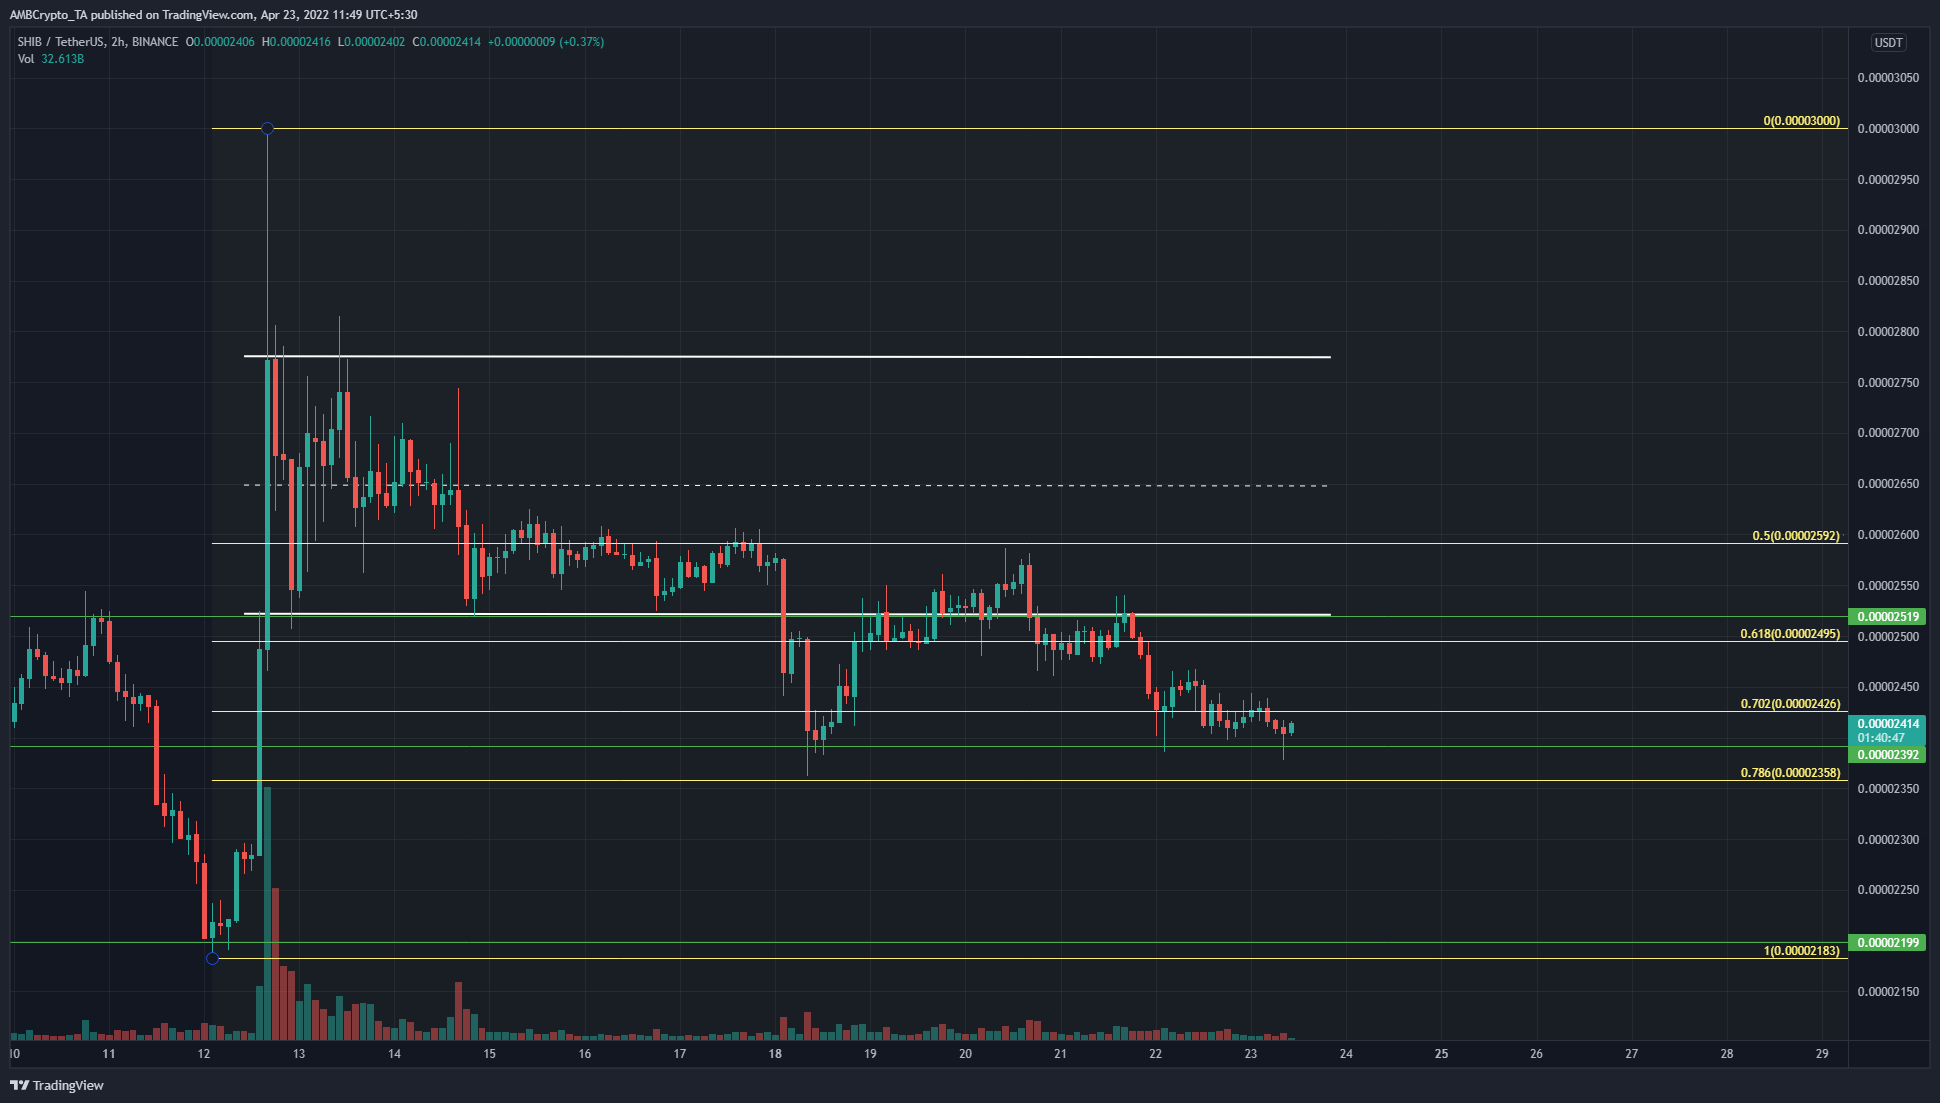
Earlier this month, SHIB saw a large move with its swing low and swing high at $0.000022 and $0.00003. Based on this surge, a set of Fibonacci levels (yellow) was plotted. A short-term range was also seen (white) from $0.0000252 to $0.0000275.
SHIB had slipped beneath the range lows, and at the time of writing was headed toward the 78.6% retracement level at $0.0000236. There was also a level of support at $0.0000239, where SHIB has bounced from recently.
The trading volume in the past week has been low. This suggested that the downtrend of the past few days did not have a strong conviction from market participants. Together with the retracement levels plotted, there was a hint that SHIB was in retracement mode.
Rationale
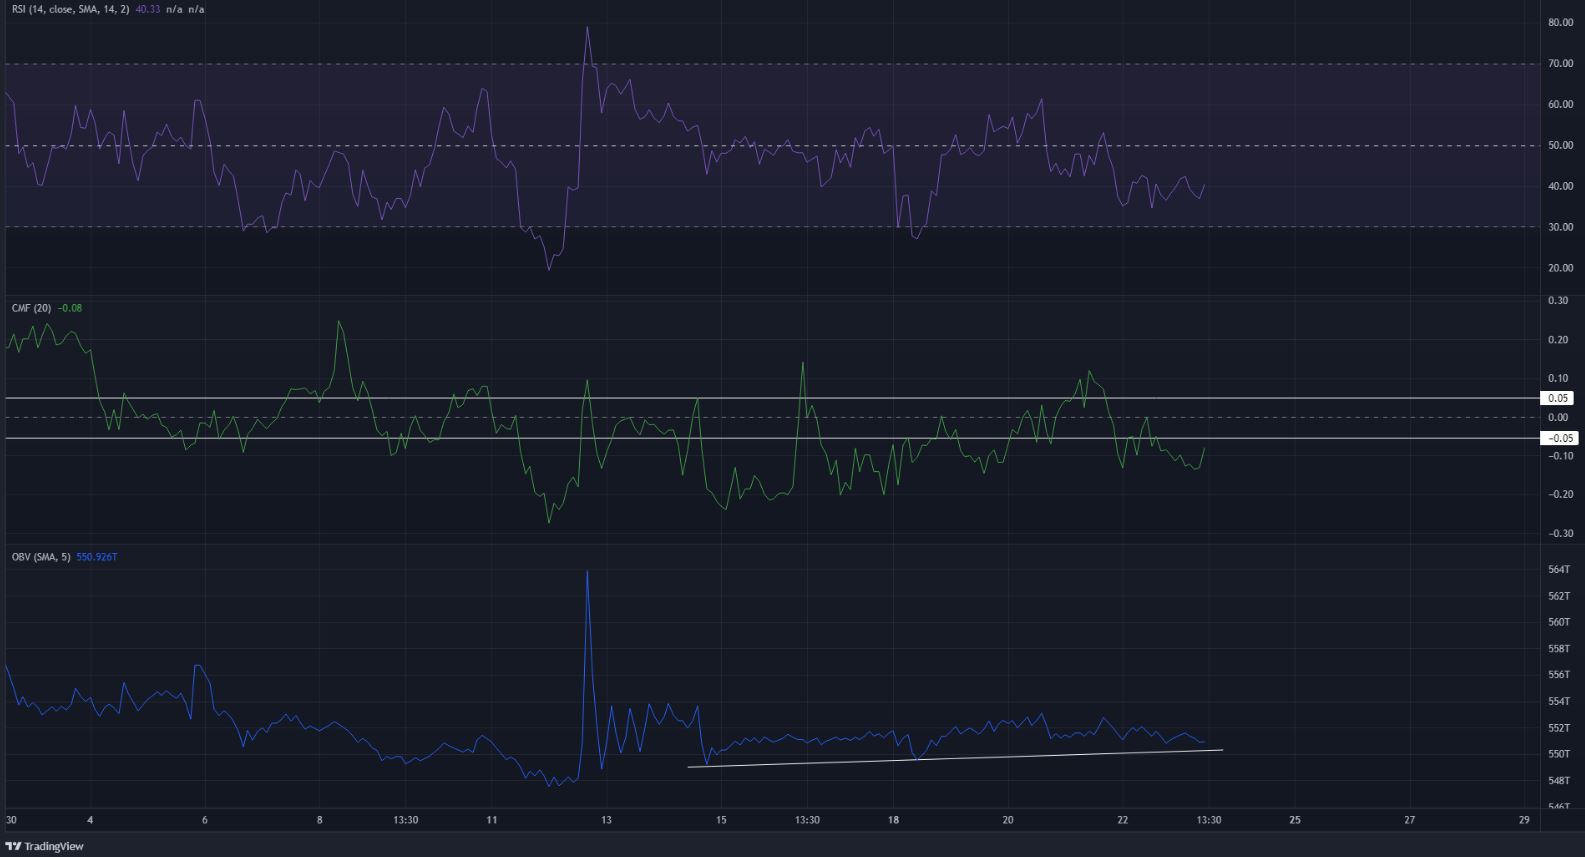
The RSI has not been well above neutral 50 in the past few days, which suggested that the trend and momentum have been bearish for the better part of last week. The Chaikin Money Flow also told a similar tale and indicated that selling pressure has been strong in the past few days as it stayed below -0.05 for a good portion of time.
Interestingly, the OBV has climbed ever so slightly over the past ten days, even though SHIB descended on the price chart. The price was also within the 61.8%-78.6% retracement levels. Therefore, it was possible that SHIB is in an accumulation phase.
Conclusion
The near-term price action and momentum suggested further bearishness. At the same time, the slight uptick on the OBV, as well as the Fibonacci levels, suggested that bulls still have some strength in the market so long as $0.0000236 holds as support.


