Ethena was founded in 2023 by Guy Young through Ethena Labs. Ethena Labs was established to reshape the decentralized finance (DeFi) landscape. 

Guy Young, in establishing Ethena Labs, brought extensive experience after years of working in TradFi. Young’s vast experience in the finance sector spurred the development of a new kind of financial product. 

Ethena, as an idea, was inspired by the inefficiencies of traditional stablecoins. This was a problem Arthur Hayes, Founder of Bitmex, discussed earlier. 

Young adopted the concept and attempted to leverage Ethereum’s unique properties, including liquid staking, to produce a neutral stance. The adoption of this concept gave birth to Ethena’s main product – USDe. 

Ethena aims to solve the problem of over-reliance on the traditional banking infrastructure with already existing stablecoins. 

Thus, the Ethena model is aimed at offering derivative infrastructure to help Ethereum transition into a yield-bearing synthetic dollar. In essence, Ethena’s first product, USDe, was designed as a delta-neutral synthetic dollar. 

Users deposited USD, Ethereum, or other liquid staking tokens as collateral to create USDe. In July 2023, Ethena’s idea became a reality after securing its first funding round, raising $6 million. Dragonfly led the funding, while other crypto players, including Arthur Hayes, Maelstrom, and derivatives exchanges, participated too. 

After the seed funding, Ethena completed a $100 million fundraising round in December 2024. Major investors such as Franklin Templeton and F-Prime Capital joined the fund drive. In March 2024, the second B-series funding round raised an additional $16 million, bringing the total to $136 million. 

The funding paved the way for the launch of its stablecoin and bond assets. After a successful funding round, Ethena’s USDe was launched in February 2024. Shortly after its launch, the synthetic dollar USDe saw massive adoption and established itself as a major player in the crypto space. 

In fact, by December 2024, USDe’s supply hit a record $6 billion, making it the third-largest stablecoin. It also became the fastest USD-denominated stablecoin to reach a $5 billion supply. 

Coupled with that, 2024 proved successful in revenue generation. Ethena surpassed $1.2 billion in annualized revenue by its first year of operation. By December 2024, the protocol had also recorded the highest FTE. 

With adoption and market acceptance, Ethena’s growth has remained steady over the past 2 years. In fact, the Protocol’s Total Value Locked rose to $14.9 billion in 2025, before falling to $5.5 billion at press time. 

Besides USDe, Ethena’s governance and utility token, ENA, has also evolved into a productive asset that secures the protocol. Also, ENA is used to accrue revenue for stakers. 

To keep pace with rapid growth, Ethena has continued to expand its scope through upgrades and ecosystem developments. For instance, Ethena raised $100 million and launched iUSDe in 2025. This product is specifically designed for TradFi, allowing asset managers, prime brokers and private credit funds to hold yield-bearing stablecoins. 

Coupled with that, Ethena has undergone a series of upgrades to improve functionality and competitiveness. The network’s Mint and Redeem V2 contract was upgraded to optimize the minting and burning of USDe mechanisms. 

Finally, Ethena activated the fee switch, allowing protocol revenue to be shared with ENA token holders. The introduction unlocked millions in token buybacks after reaching a major USDe revenue and supply milestone.

In July 2025, Ethena and StablecoinX announced an ENA token buyback program, with $260 million allocated to repurchase locked ENA tokens. Stablecoinx would acquire 3 billion ENA to help stabilize the ecosystem. 

VIEW MORE

Overview

Market Cap
$795.21M
+0.8%
Volume (24H)
$114.04M
Volume (7D)
$741.47M
+14.5%
Max Supply
15,000,000,000 ENA
Circulating Supply
9,560,937,500 ENA
All-Time High
$1.52
-94.5%
All-Time Low
$0.070279
+18.4%
(above ATL)

Prediction Analysis

Current Price
$0.08
Sentiment
Bearish
50-Day SMA
$0.08
Price Prediction
$0.02
-70.10%
Fear & Greed Index
200-Day SMA
$0.12
Green Days
10 / last 30 (34.5%)
Volatility
4.36%
Moderate
14-Day RSI
67.79
Neutral

Profit Calculator

Select asset
%
%
Total Profit
$0
(0%)
Total Exit Amount
$0
Total Investment Fee
$0
Total Exit Fee
$0

Ethena Price Prediction

Current Price
$0.08
2031
$0.00
2036
$0.00
2041
$0.00
2046
$0.00

Results are based solely on your predicted price change. They are not indicators of future performance and do not take into account different performance scenarios, historical data, or the effect of fees or other charges.

VIEW MORE

Short-Term Ethena Price Targets

Date Prediction Change
Jul 16, 2026 $0.09 +5.00%
Jul 17, 2026 $0.09 +10.25%
Jul 18, 2026 $0.10 +15.76%
Jul 19, 2026 $0.10 +21.55%
Jul 20, 2026 $0.11 +27.63%
Jul 21, 2026 $0.11 +34.01%
Jul 22, 2026 $0.12 +40.71%

Ethena was trading at $0.094 at press time after extending its stay below the critical support level of $0.1. ENA's bearish outlook was strengthened after closing below $0.1 for two consecutive weeks. In June 2026, this price range had become major resistance, with ENA holding below the Simple Moving Averages at $0.1. In the short term, ENA has been strongly bearish, holding below the SMA. If the trend persists and holds below these key levels, ENA could drop again towards $0.08. For a trend reversal, ENA needs a clear close above $0.1. In doing so, Ethena will be strengthened enough to challenge the $0.14 resistance in June and July.

VIEW MORE

Monthly Ethena Price Prediction

Jun 30, 2026
$0.07
Jul 15, 2026
$0.08
Highest in Jul
$0.08
Lowest in Jul
$0.07
Overall Performance
Rising

Long-Term Ethena Price Prediction

Month Price AVG Price Max Price Change
Jul $0.08 $0.08 $0.08 -3.84%
Aug $0.08 $0.08 $0.08 -3.84%
Sep $0.08 $0.08 $0.08 -3.84%
Oct $0.07 $0.07 $0.07 -15.86%
Nov $0.07 $0.07 $0.07 -15.86%
Dec $0.07 $0.07 $0.07 -15.86%
Over the long term, ENA has been firmly entrenched in a bearish structure. On the monthly chart, the altcoin seemed to be closing at lower lows. At the time of writing, ENA was hovering around $0.08 for four consecutive months - A sign of strong bearishness. Even more so, the altcoin seemed to be sitting deeply below the EMA and MA, holding below these levels since December 2025. As a result, the market indicated a likelihood of sustained consolidation, with $0.08 as support. This may be a sign of extended market weakness, with ENA holding below $0.1 and potentially breaching $0.08 to $0.07. However, reclaiming and holding $0.1 will avoid this downside pressure and help the market eye $0.20 and $0.34.
VIEW MORE

Historical Price Performance

Year Highest Price Lowest Price
2026 (to date) $0 $0
2025 $1 $0
2024 $1 $0

Ethena’s native token [ENA] has traded within a descending channel since its launch in April 2024. The price action continually drifted downward within a broad descending structure. In April 2024, ENA jumped from $0.86 to $1.52. Shortly after the market crashed for five consecutive months, dropping to $0.194 before rebounding. ENA bounced back and recorded a strong rally, rallying from its 2024 low of $0.194 to $1.32. However, it closed the year at $0.90. 2025 started on a positive note, rallying to $1.3 before seeing a strong bearish run and falling to $0.250 in April. May showed some strength, recovering to $0.46. However, it then dropped again to $0.22 through June. In June 2025, the market rebounded, rallying to $0.87 through September before another dip. Since September though, ENA has traded within a downtrend, into the whole of 2026 too. In fact, the altcoin rose to $0.26 in early January, then dropped to a new all-time low of $0.079 in April 2026.

VIEW MORE

Technical Analysis

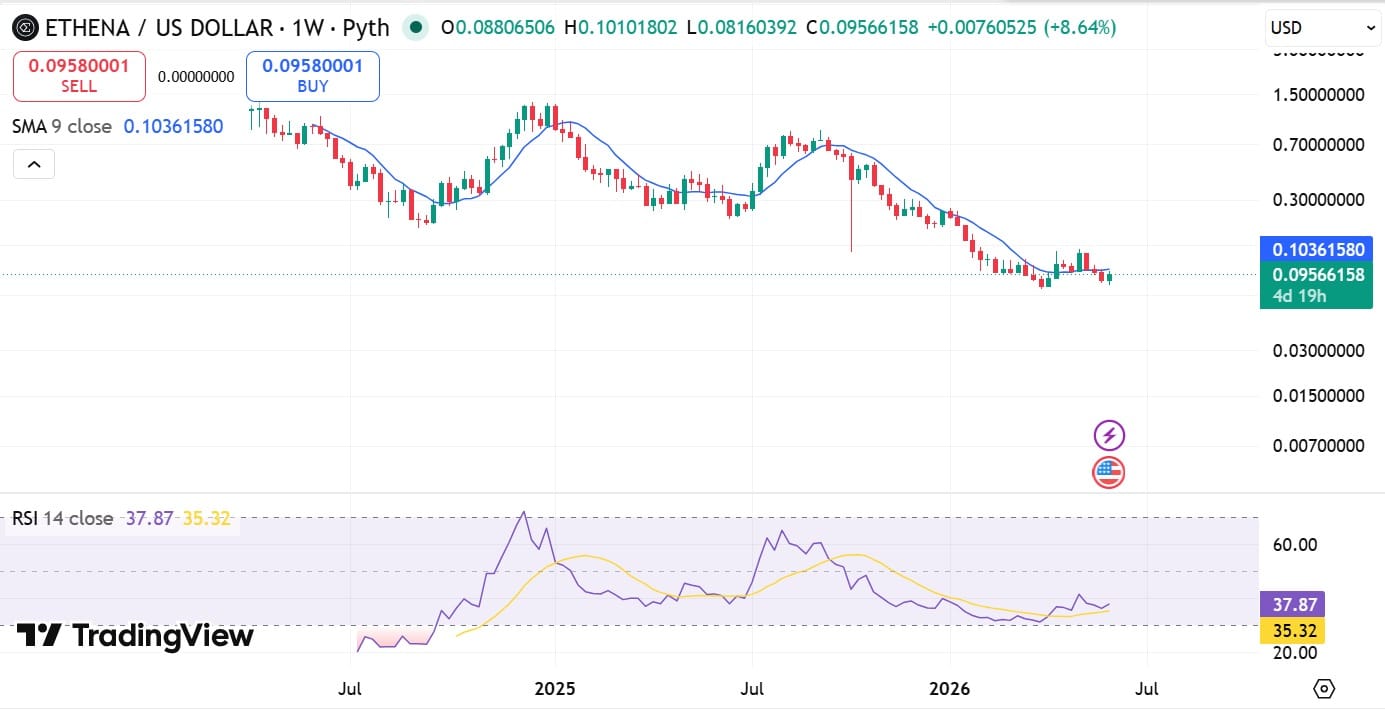
In early June 2026, Ethena seemed to be showing signs of extended weakness, holding below $0.1. As a result, ENA was trading below its moving averages at the $0.1-price level – Evidence of weaker market demand. 

Source: ENA/USDT, TradingView

At the same time, the altcoin’s Relative Strength Index (RSI) extended its stay into the bearish zone, holding at 37. The RSI at these levels confirmed the weakened demand, with sellers strongly dominating the market. If ENA continues to hold below $0.1, we could see more weakness. 

In the short term, ENA could continue to trade below $0.1 through June, with $0.8 as the support level. A short-term market reversal would mean a flip of $0.1 while targeting $0.2. 

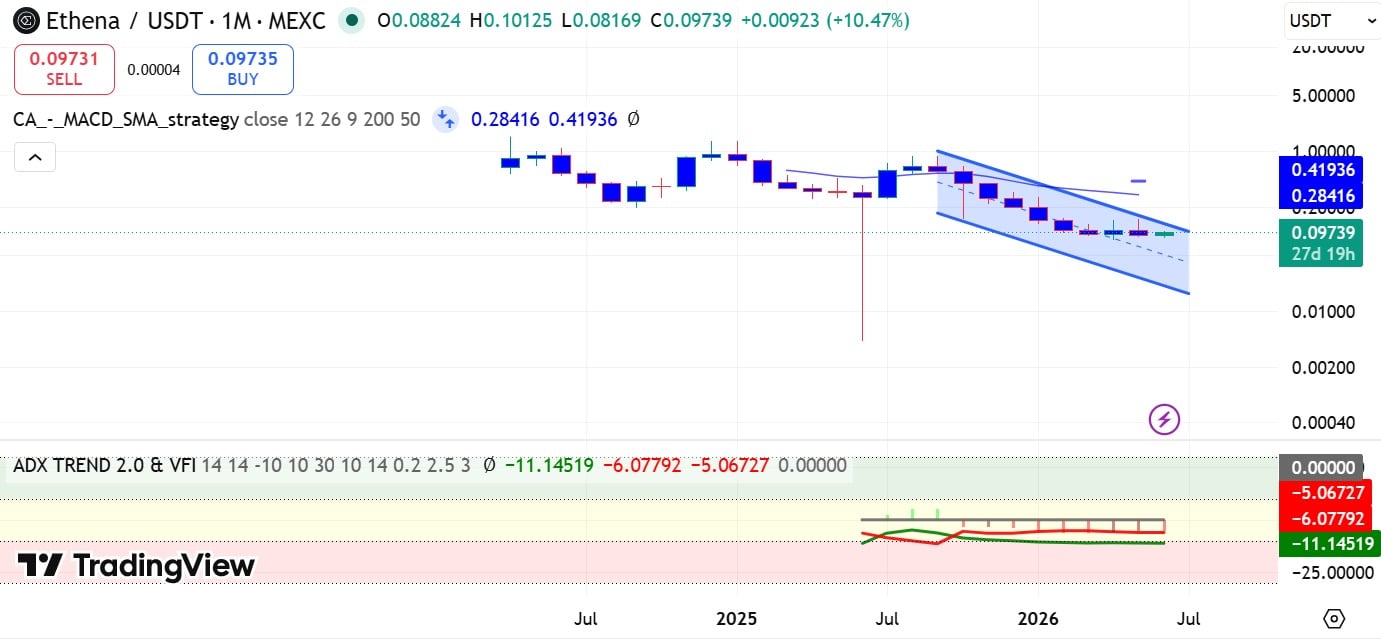
In the longer timeframe too, ENA seemed to be exhibiting strong weakness with directional momentum index holdings within the negative zone. The DMI, ADX, +DI, and -DI were all negative. This indicated that the downtrend was strong and ENA may be at risk of further losses. 

Source: ENA/USDT, TradingView

If the weakness extends itself, ENA will collapse below $0.08 and drop towards $0.07 through July.

The most bearish case for ENA is making a new all-time low in 3 to 6 months. A long-term bullish outlook would need ENA to close above $0.1 and target $0.34 in three to six months. A clear positive outlook would mean that ENA will close 2026 above the MACD SMA at $0.41, with $0.28 as the mildly bullish outlook for 2026. 

Guides

How to Read Ethena Charts and Predict Price Movements?

Most traders use candlestick charts, as they provide more information than a simple line chart. Traders can view candlesticks that represent the price action of Ethena with different granularity – for example, you could choose a 5-minute candlestick chart for extremely short-term price action or choose a weekly candlestick chart to identify long-term trends. 1-hour, 4-hour, and 1-day candlestick charts are among the most popular.

Let’s use a 1-hour candlestick chart as an example of how this type of price chart gives us information about opening and closing prices. The chart is divided into “candles” that give us information about Ethena’s price action in 1-hour chunks. Each candlestick will display the asset’s opening price, closing price, as well as the highest and lowest prices reached within that period.

Ethena Price Prediction Indicators

Moving averages are among the most popular Ethena price prediction tools. As the name suggests, a moving average provides the average closing price over a selected time frame, which is divided into a number of periods of the same length. For example, a 12-day simple moving average is calculated by summing the closing prices over the last 12 days and dividing the result by 12.

In addition to the simple moving average (SMA), traders also use another type of moving average called the exponential moving average (EMA). The EMA gives more weight to recent prices, and therefore reacts more quickly to changes in market conditions.

What Affects the Price of Ethena?

Just like with any other asset, the price action of Ethena is driven by supply and demand. These dynamics can be influenced by fundamental events such as block reward halvings, hard forks, or new protocol updates. Regulations, adoption by companies and governments, cryptocurrency exchange hacks, and other real-world events can also affect market sentiment.

Technical indicators such as moving averages, RSI, and trading volume are also used by traders to anticipate price movements and identify potential trend reversals.

FAQs on Ethena Price Predictions

As of today, Ethena (ENA) is trading at $0.083199. The current market sentiment is Bearish, with RSI at 67.79 (Neutral) and volatility classified as Moderate.
Based on our technical analysis and projected annual growth rate, Ethena could reach $0.024877 by 2027. This estimate assumes continued market momentum and adoption trends.
According to our technical analysis indicators, the Ethena price prediction is forecasted to reach $0.000199 within the next five years (by 2031). Over the last 30 days, Ethena recorded green days 35% of the time.
Based on multiple technical indicators, the current outlook for Ethena in 2026 is Bearish. RSI currently sits at 67.79, which indicates Neutral momentum. However, investors should evaluate both technical signals and fundamental developments before making any investment decisions.
Long-term forecasts indicate that Ethena may continue to grow over the next decade if adoption, technology development, and global crypto demand continue to expand.
While Ethena's future value depends on various factors, technical indicators suggest it could experience both bullish and bearish cycles over time. Long-term investors typically monitor RSI levels, moving averages, and broader market sentiment when evaluating ENA's future trajectory.
Disclaimer

AMBCrypto's content is meant to be informational in nature and should not be interpreted as investment advice. Trading, buying or selling cryptocurrencies should be considered a high-risk investment and every reader is advised to do their own research before making any decisions.